29
/
en
AIzaSyAYiBZKx7MnpbEhh9jyipgxe19OcubqV5w
April 1, 2024
116839
Cyprus
CYP
true
2
1
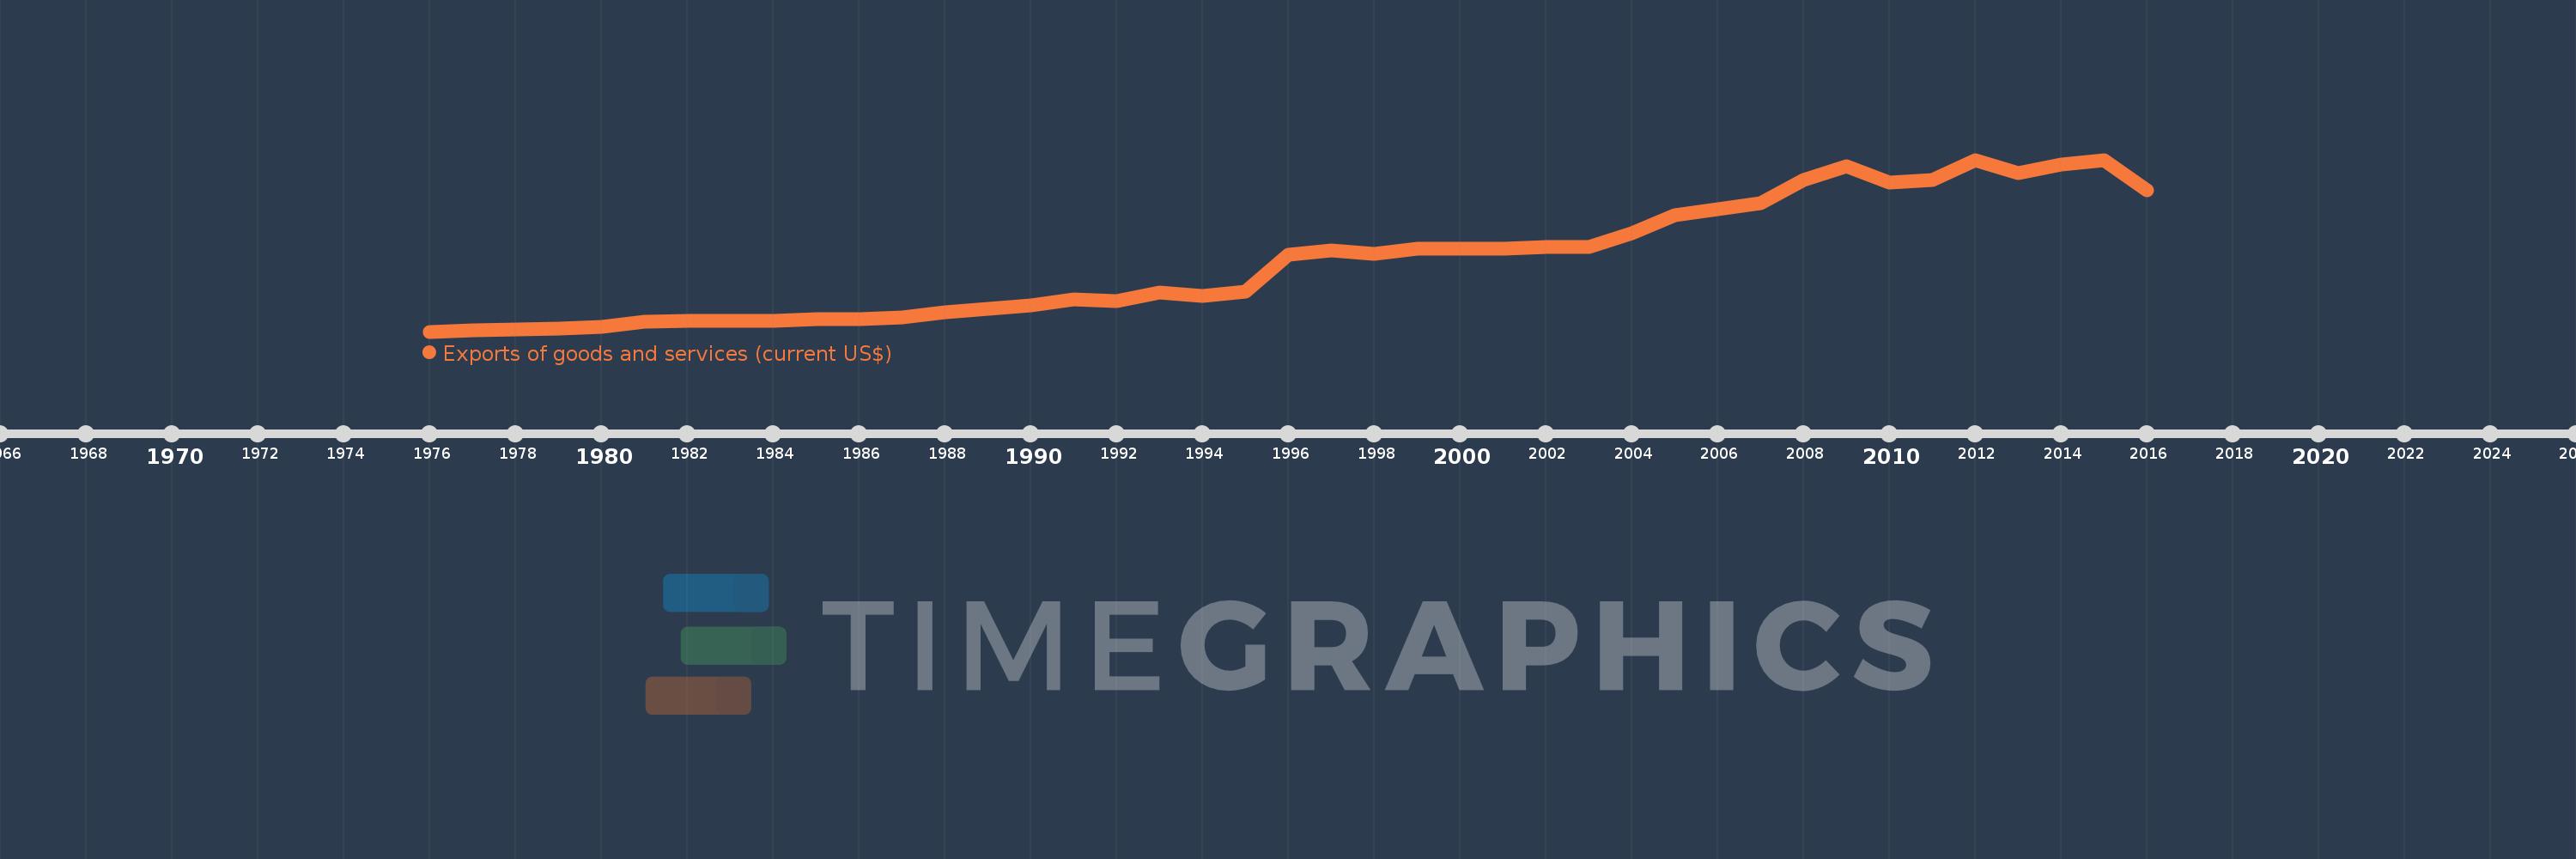
Exports of goods and services (current US$)
2016,2015,2014,2013,2012,2011,2010,2009,2008,2007,2006,2005,2004,2003,2002,2001,2000,1999,1998,1997,1996,1995,1994,1993,1992,1991,1990,1989,1988,1987,1986,1985,1984,1983,1982,1981,1980,1979,1978,1977,1976
This statistics in other country:
AfghanistanAlbaniaAlgeriaAngolaAntigua and BarbudaArab WorldArgentinaArmeniaArubaAustraliaAustriaAzerbaijanBahamas, TheBahrainBangladeshBarbadosBelarusBelgiumBelizeBeninBermudaBhutanBoliviaBosnia and HerzegovinaBotswanaBrazilBrunei DarussalamBulgariaBurkina FasoBurundiCabo VerdeCambodiaCameroonCanadaCaribbean small statesCentral African RepublicCentral Europe and the BalticsChadChileChinaColombiaComorosCongo, Dem. Rep.Congo, Rep.Costa RicaCote d'IvoireCroatiaCubaCyprusCzech RepublicDenmarkDjiboutiDominicaDominican RepublicEarly-demographic dividendEast Asia & PacificEast Asia & Pacific (excluding high income)East Asia & Pacific (IDA & IBRD countries)EcuadorEgypt, Arab Rep.El SalvadorEquatorial GuineaEritreaEstoniaEthiopiaEuro areaEurope & Central AsiaEurope & Central Asia (excluding high income)Europe & Central Asia (IDA & IBRD countries)European UnionFaroe IslandsFijiFinlandFragile and conflict affected situationsFranceFrench PolynesiaGabonGambia, TheGeorgiaGermanyGhanaGreeceGrenadaGuatemalaGuineaGuinea-BissauGuyanaHaitiHeavily indebted poor countries (HIPC)High incomeHondurasHong Kong SAR, ChinaHungaryIBRD onlyIcelandIDA & IBRD totalIDA blendIDA onlyIDA totalIndiaIndonesiaIran, Islamic Rep.IraqIrelandIsraelItalyJamaicaJapanJordanKazakhstanKenyaKiribatiKorea, Rep.KosovoKuwaitKyrgyz RepublicLao PDRLate-demographic dividendLatin America & Caribbean Latin America & Caribbean (excluding high income)Latin America & the Caribbean (IDA & IBRD countries)LatviaLeast developed countries: UN classificationLebanonLesothoLiberiaLibyaLithuaniaLow & middle incomeLow incomeLower middle incomeLuxembourgMacao SAR, ChinaMacedonia, FYRMadagascarMalawiMalaysiaMaldivesMaliMaltaMauritaniaMauritiusMexicoMicronesia, Fed. Sts.Middle East & North AfricaMiddle East & North Africa (excluding high income)Middle East & North Africa (IDA & IBRD countries)Middle incomeMoldovaMongoliaMontenegroMoroccoMozambiqueMyanmarNamibiaNepalNetherlandsNew CaledoniaNew ZealandNicaraguaNigerNigeriaNorth AmericaNorwayOECD membersOmanOther small statesPacific island small statesPakistanPalauPanamaPapua New GuineaParaguayPeruPhilippinesPolandPortugalPost-demographic dividendPre-demographic dividendPuerto RicoQatarRomaniaRussian FederationRwandaSamoaSaudi ArabiaSenegalSerbiaSeychellesSierra LeoneSingaporeSlovak RepublicSloveniaSmall statesSolomon IslandsSomaliaSouth AfricaSouth AsiaSouth Asia (IDA & IBRD)South SudanSpainSri LankaSt. Kitts and NevisSt. LuciaSt. Vincent and the GrenadinesSub-Saharan Africa Sub-Saharan Africa (excluding high income)Sub-Saharan Africa (IDA & IBRD countries)SudanSurinameSwazilandSwedenSwitzerlandSyrian Arab RepublicTajikistanTanzaniaThailandTimor-LesteTogoTongaTrinidad and TobagoTunisiaTurkeyTurkmenistanUgandaUkraineUnited Arab EmiratesUnited KingdomUnited StatesUpper middle incomeUruguayUzbekistanVanuatuVenezuela, RBVietnamWest Bank and GazaWorldYemen, Rep.ZambiaZimbabwe Timeline:
This timeline shows a graph from 1976 to 2016 of Cyprus. No data until 1975. Number of actual observations by date: 41.
Source name:
World Development Indicators
Source organization:
World Bank national accounts data, and OECD National Accounts data files.
Categories, topics:
Economy & Growth, Trade
Last updated:
apr 23, 2017
Indicators value changes by year
Minimum:
173.853 mln
jan 1, 1976
Maximum:
14.517 bln
jan 1, 2012
At the date of observation
Value
Absolute change
Change from previous value
jan 1, 1976
173.853 mln
+173.853 mln
0.0%
jan 1, 1977
286.579 mln
+112.725 mln
64.84%
jan 1, 1978
351.378 mln
+64.799 mln
22.61%
jan 1, 1979
408.07 mln
+56.692 mln
16.13%
jan 1, 1980
575.809 mln
+167.739 mln
41.11%
jan 1, 1981
975.008 mln
+399.199 mln
69.33%
jan 1, 1982
1.049 bln
+73.983 mln
7.59%
jan 1, 1983
1.1 bln
+50.54 mln
4.82%
jan 1, 1984
1.089 bln
-10.511 mln
-0.96%
jan 1, 1985
1.245 bln
+156.232 mln
14.35%
jan 1, 1986
1.185 bln
-60.709 mln
-4.88%
jan 1, 1987
1.392 bln
+207.436 mln
17.51%
jan 1, 1988
1.752 bln
+359.91 mln
25.86%
jan 1, 1989
2.057 bln
+305.293 mln
17.43%
jan 1, 1990
2.348 bln
+291.185 mln
14.15%
jan 1, 1991
2.879 bln
+531.097 mln
22.62%
jan 1, 1992
2.717 bln
-162.529 mln
-5.64%
jan 1, 1993
3.419 bln
+701.605 mln
25.82%
jan 1, 1994
3.13 bln
-288.72 mln
-8.45%
jan 1, 1995
3.541 bln
+411.46 mln
13.15%
jan 1, 1996
6.561 bln
+3.019 bln
85.26%
jan 1, 1997
6.95 bln
+389.896 mln
5.94%
jan 1, 1998
6.638 bln
-312.469 mln
-4.5%
jan 1, 1999
7.113 bln
+474.699 mln
7.15%
jan 1, 2000
7.104 bln
-8.678 mln
-0.12%
jan 1, 2001
7.125 bln
+20.608 mln
0.29%
jan 1, 2002
7.208 bln
+83.233 mln
1.17%
jan 1, 2003
7.25 bln
+42.552 mln
0.59%
jan 1, 2004
8.42 bln
+1.17 bln
16.13%
jan 1, 2005
9.912 bln
+1.492 bln
17.72%
jan 1, 2006
10.416 bln
+504.617 mln
5.09%
jan 1, 2007
10.903 bln
+486.656 mln
4.67%
jan 1, 2008
12.823 bln
+1.921 bln
17.61%
jan 1, 2009
13.945 bln
+1.122 bln
8.75%
jan 1, 2010
12.641 bln
-1.304 bln
-9.35%
jan 1, 2011
12.835 bln
+194.346 mln
1.54%
jan 1, 2012
14.517 bln
+1.681 bln
13.1%
jan 1, 2013
13.383 bln
-1.133 bln
-7.81%
jan 1, 2014
14.125 bln
+742.056 mln
5.54%
jan 1, 2015
14.496 bln
+370.754 mln
2.62%
jan 1, 2016
11.974 bln
-2.522 bln
-17.4%
Ranking of countries by current statistics by years


Comments: