29
/
en
AIzaSyAYiBZKx7MnpbEhh9jyipgxe19OcubqV5w
April 1, 2024
74909
Azerbaijan
AZE
true
2
1
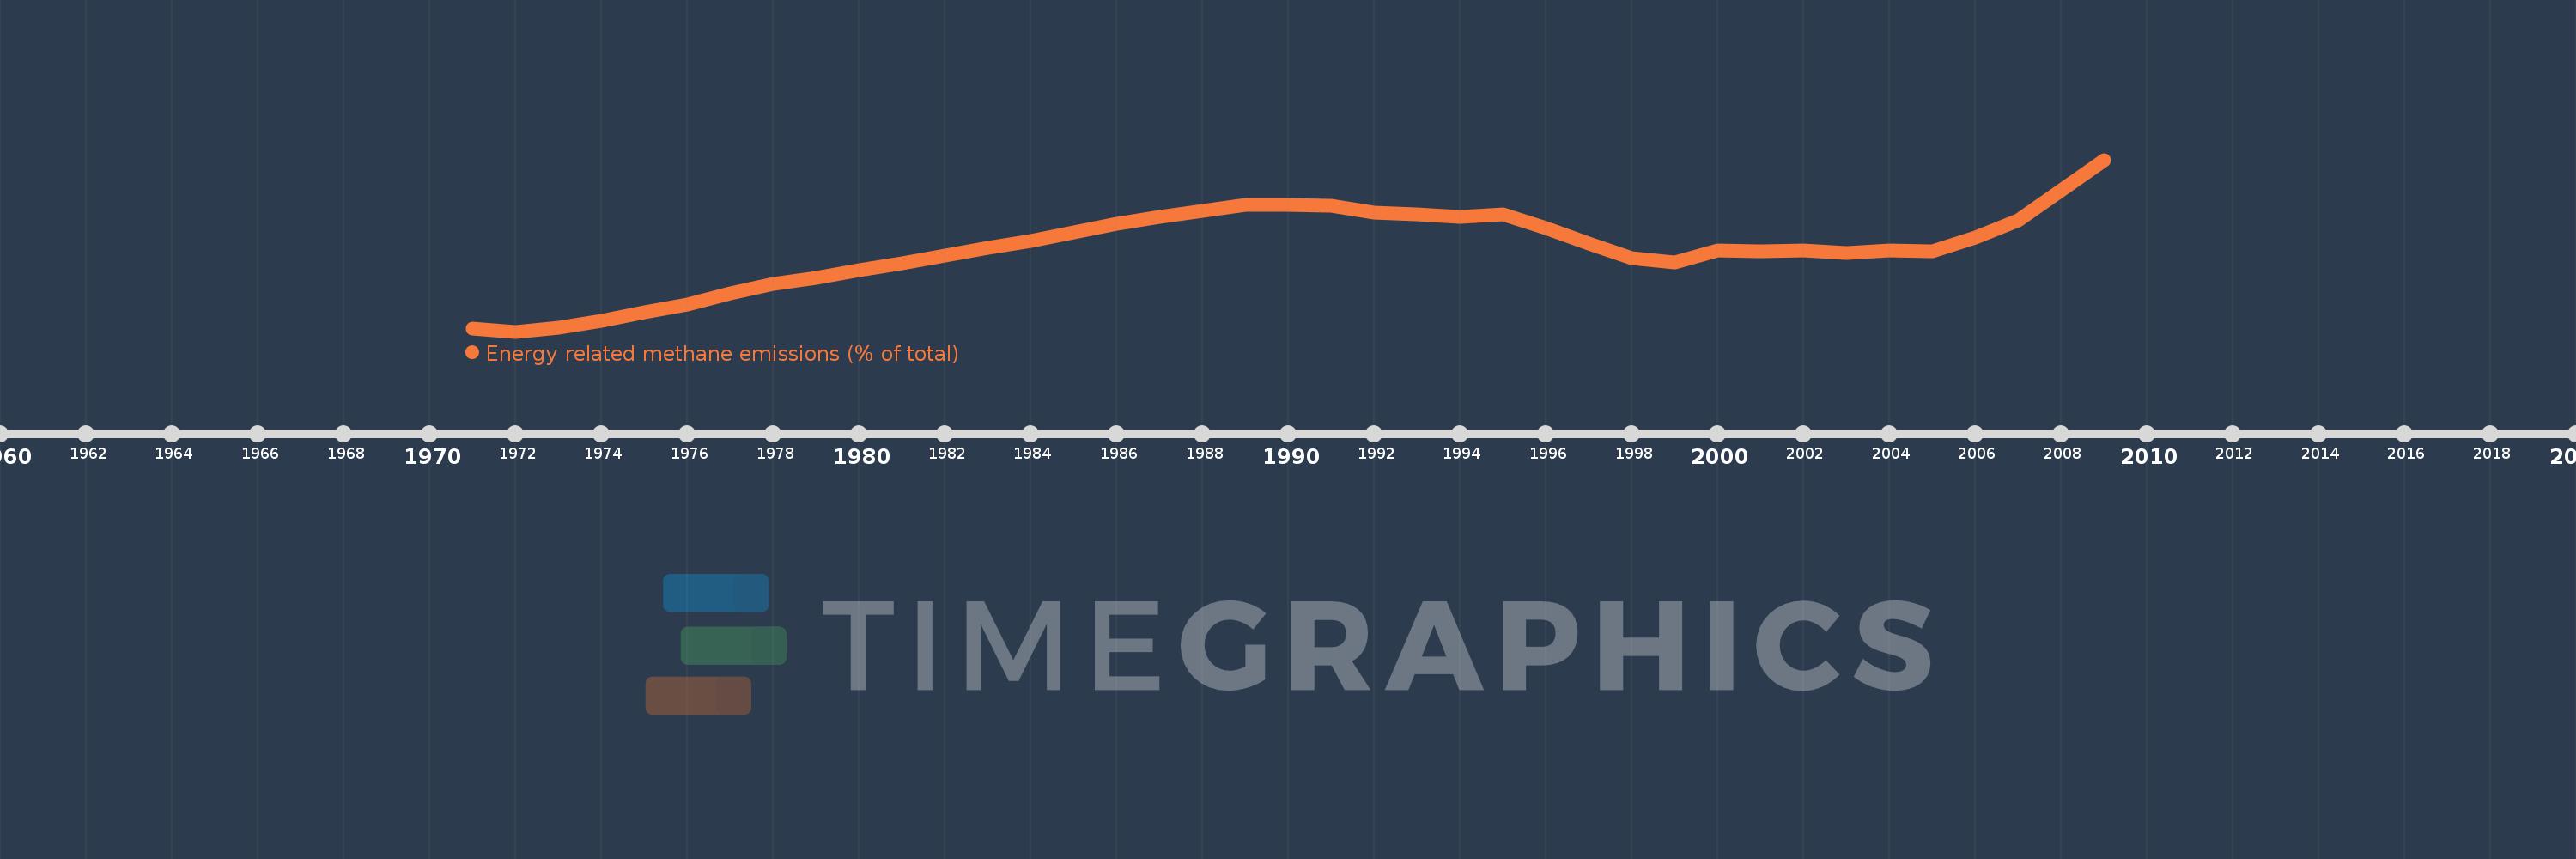
Energy related methane emissions (% of total)
2009,2008,2007,2006,2005,2004,2003,2002,2001,2000,1999,1998,1997,1996,1995,1994,1993,1992,1991,1990,1989,1988,1987,1986,1985,1984,1983,1982,1981,1980,1979,1978,1977,1976,1975,1974,1973,1972,1971
This statistics in other country:
AfghanistanAlbaniaAlgeriaAmerican SamoaAngolaAntigua and BarbudaArab WorldArgentinaArmeniaArubaAustraliaAustriaAzerbaijanBahamas, TheBahrainBangladeshBarbadosBelarusBelgiumBelizeBeninBermudaBhutanBoliviaBosnia and HerzegovinaBotswanaBrazilBritish Virgin IslandsBrunei DarussalamBulgariaBurkina FasoBurundiCabo VerdeCambodiaCameroonCanadaCaribbean small statesCayman IslandsCentral African RepublicCentral Europe and the BalticsChadChileChinaColombiaComorosCongo, Dem. Rep.Congo, Rep.Costa RicaCote d'IvoireCroatiaCubaCyprusCzech RepublicDenmarkDjiboutiDominicaDominican RepublicEarly-demographic dividendEast Asia & PacificEast Asia & Pacific (excluding high income)East Asia & Pacific (IDA & IBRD countries)EcuadorEgypt, Arab Rep.El SalvadorEquatorial GuineaEritreaEstoniaEthiopiaEuro areaEurope & Central AsiaEurope & Central Asia (excluding high income)Europe & Central Asia (IDA & IBRD countries)European UnionFaroe IslandsFijiFinlandFragile and conflict affected situationsFranceFrench PolynesiaGabonGambia, TheGeorgiaGermanyGhanaGibraltarGreeceGreenlandGrenadaGuamGuatemalaGuineaGuinea-BissauGuyanaHaitiHeavily indebted poor countries (HIPC)High incomeHondurasHong Kong SAR, ChinaHungaryIBRD onlyIcelandIDA & IBRD totalIDA blendIDA onlyIDA totalIndiaIndonesiaIran, Islamic Rep.IraqIrelandIsraelItalyJamaicaJapanJordanKazakhstanKenyaKiribatiKorea, Dem. People’s Rep.Korea, Rep.KuwaitKyrgyz RepublicLao PDRLate-demographic dividendLatin America & Caribbean Latin America & Caribbean (excluding high income)Latin America & the Caribbean (IDA & IBRD countries)LatviaLeast developed countries: UN classificationLebanonLesothoLiberiaLibyaLithuaniaLow & middle incomeLow incomeLower middle incomeLuxembourgMacao SAR, ChinaMacedonia, FYRMadagascarMalawiMalaysiaMaldivesMaliMaltaMarshall IslandsMauritaniaMauritiusMexicoMicronesia, Fed. Sts.Middle East & North AfricaMiddle East & North Africa (excluding high income)Middle East & North Africa (IDA & IBRD countries)Middle incomeMoldovaMongoliaMoroccoMozambiqueMyanmarNamibiaNauruNepalNetherlandsNew CaledoniaNew ZealandNicaraguaNigerNigeriaNorth AmericaNorthern Mariana IslandsNorwayOECD membersOmanOther small statesPacific island small statesPakistanPalauPanamaPapua New GuineaParaguayPeruPhilippinesPolandPortugalPost-demographic dividendPre-demographic dividendPuerto RicoQatarRomaniaRussian FederationRwandaSamoaSao Tome and PrincipeSaudi ArabiaSenegalSerbiaSeychellesSierra LeoneSingaporeSlovak RepublicSloveniaSmall statesSolomon IslandsSomaliaSouth AfricaSouth AsiaSouth Asia (IDA & IBRD)SpainSri LankaSt. Kitts and NevisSt. LuciaSt. Vincent and the GrenadinesSub-Saharan Africa Sub-Saharan Africa (excluding high income)Sub-Saharan Africa (IDA & IBRD countries)SudanSurinameSwazilandSwedenSwitzerlandSyrian Arab RepublicTajikistanTanzaniaThailandTimor-LesteTogoTongaTrinidad and TobagoTunisiaTurkeyTurkmenistanTurks and Caicos IslandsTuvaluUgandaUkraineUnited Arab EmiratesUnited KingdomUnited StatesUpper middle incomeUruguayUzbekistanVanuatuVenezuela, RBVietnamVirgin Islands (U.S.)WorldYemen, Rep.ZambiaZimbabwe Timeline:
This timeline shows a graph from 1971 to 2009 of Azerbaijan. No data until 1970. Number of actual observations by date: 39.
Source name:
World Development Indicators
Source organization:
World Bank staff estimates from original source: European Commission, Joint Research Centre (JRC)/Netherlands Environmental Assessment Agency (PBL). Emission Database for Global Atmospheric Research (EDGAR): http://edgar.jrc.ec.europa.eu/.
Categories, topics:
Energy & Mining, Environment
Last updated:
apr 23, 2017
Indicators value changes by year
Minimum:
30.859
jan 1, 1972
Maximum:
57.952
jan 1, 2009
At the date of observation
Value
Absolute change
Change from previous value
jan 1, 1971
31.328
+31.328
0.0%
jan 1, 1972
30.859
-0.47
-1.5%
jan 1, 1973
31.434
+0.575
1.86%
jan 1, 1974
32.581
+1.148
3.65%
jan 1, 1975
33.861
+1.28
3.93%
jan 1, 1976
35.184
+1.323
3.91%
jan 1, 1977
36.896
+1.712
4.87%
jan 1, 1978
38.313
+1.416
3.84%
jan 1, 1979
39.336
+1.024
2.67%
jan 1, 1980
40.49
+1.154
2.93%
jan 1, 1981
41.612
+1.122
2.77%
jan 1, 1982
42.802
+1.19
2.86%
jan 1, 1983
44.018
+1.216
2.84%
jan 1, 1984
45.18
+1.163
2.64%
jan 1, 1985
46.52
+1.34
2.97%
jan 1, 1986
47.846
+1.326
2.85%
jan 1, 1987
48.968
+1.122
2.34%
jan 1, 1988
49.91
+0.942
1.92%
jan 1, 1989
50.857
+0.947
1.9%
jan 1, 1990
50.786
-0.071
-0.14%
jan 1, 1991
50.74
-0.046
-0.09%
jan 1, 1992
49.603
-1.137
-2.24%
jan 1, 1993
49.313
-0.291
-0.59%
jan 1, 1994
48.982
-0.33
-0.67%
jan 1, 1995
49.396
+0.414
0.84%
jan 1, 1996
47.224
-2.172
-4.4%
jan 1, 1997
44.794
-2.43
-5.15%
jan 1, 1998
42.417
-2.377
-5.31%
jan 1, 1999
41.804
-0.613
-1.45%
jan 1, 2000
43.622
+1.818
4.35%
jan 1, 2001
43.518
-0.104
-0.24%
jan 1, 2002
43.611
+0.093
0.21%
jan 1, 2003
43.287
-0.323
-0.74%
jan 1, 2004
43.662
+0.374
0.86%
jan 1, 2005
43.47
-0.192
-0.44%
jan 1, 2006
45.627
+2.157
4.96%
jan 1, 2007
48.358
+2.731
5.99%
jan 1, 2008
53.143
+4.784
9.89%
jan 1, 2009
57.952
+4.809
9.05%
Ranking of countries by current statistics by years


Comments: