29
/
en
AIzaSyAYiBZKx7MnpbEhh9jyipgxe19OcubqV5w
April 1, 2024
28060
East Asia & Pacific (excluding high income)
EAP
false
2
1
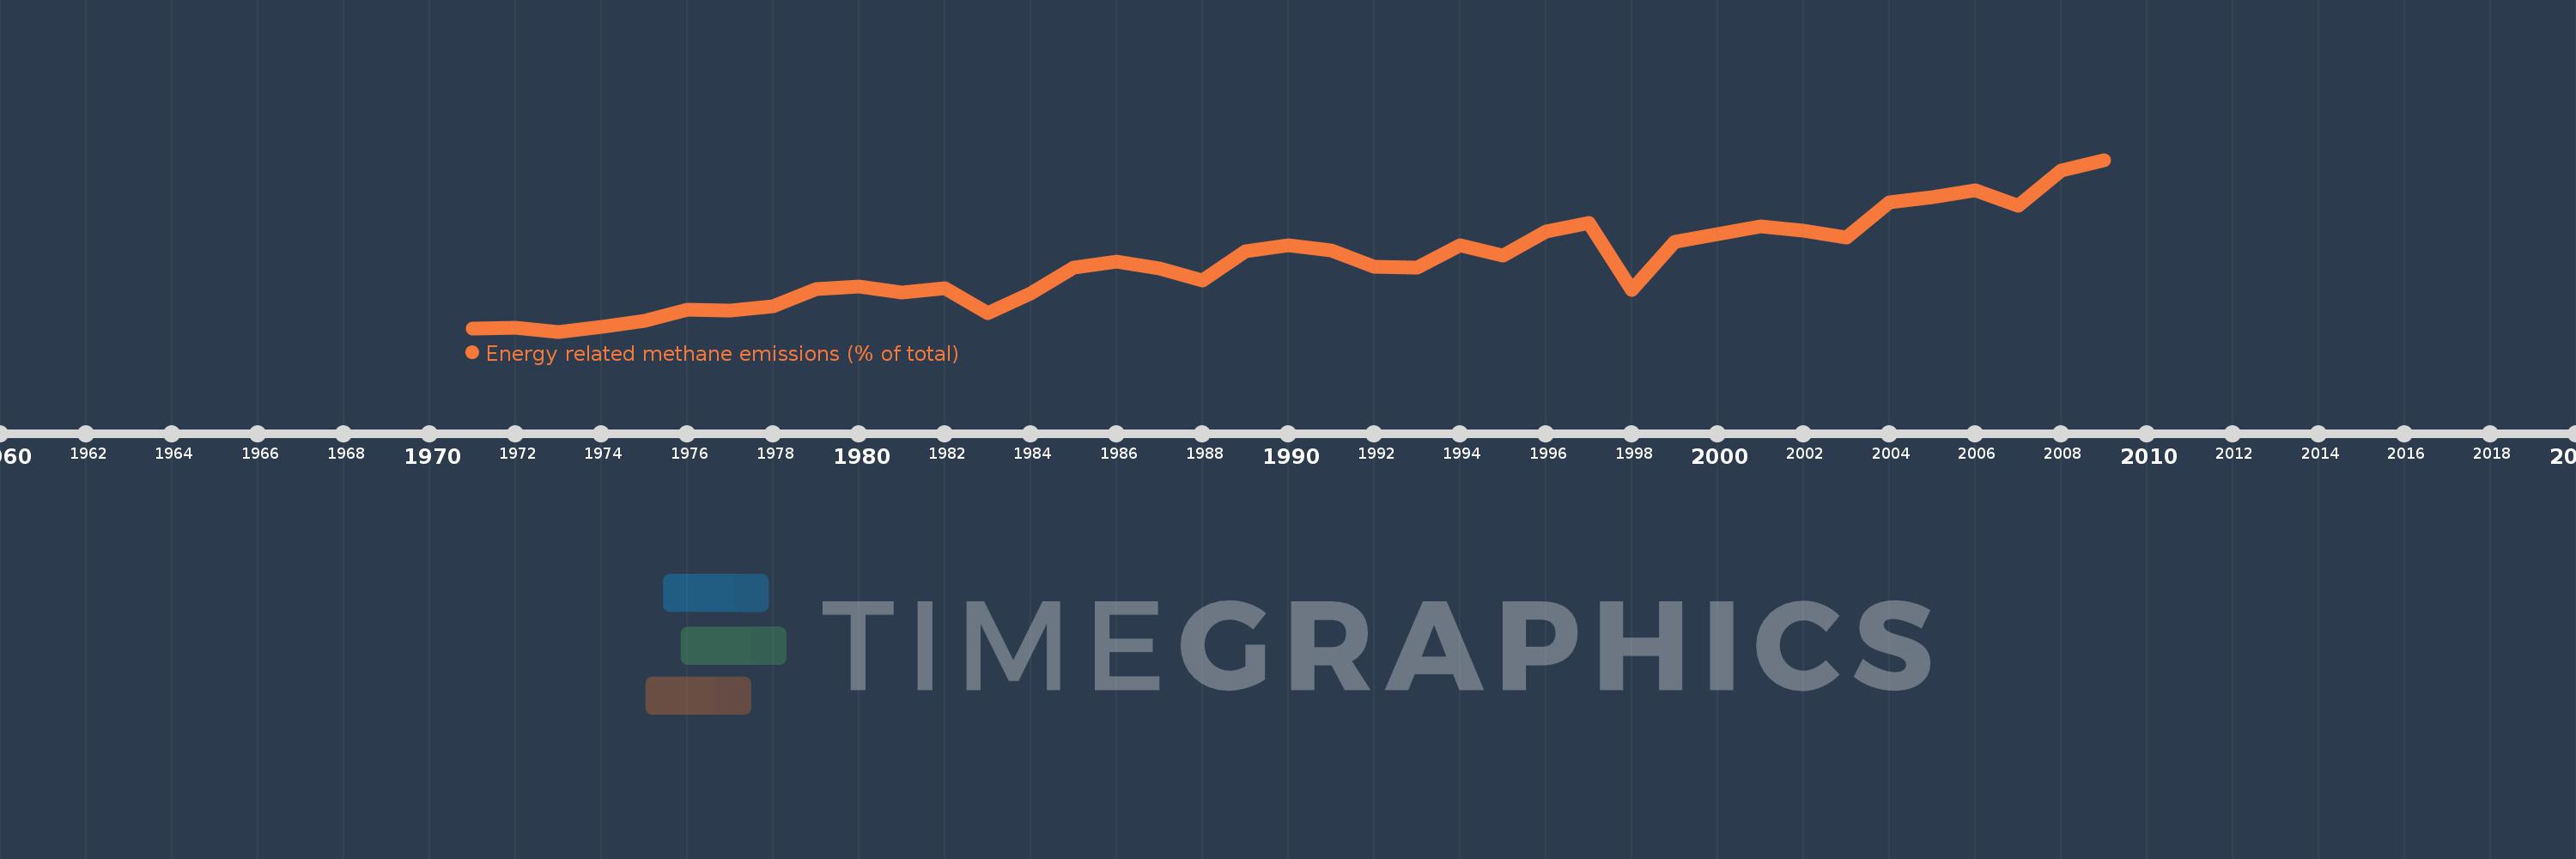
Energy related methane emissions (% of total)
2009,2008,2007,2006,2005,2004,2003,2002,2001,2000,1999,1998,1997,1996,1995,1994,1993,1992,1991,1990,1989,1988,1987,1986,1985,1984,1983,1982,1981,1980,1979,1978,1977,1976,1975,1974,1973,1972,1971
This statistics in other country:
AfghanistanAlbaniaAlgeriaAmerican SamoaAngolaAntigua and BarbudaArab WorldArgentinaArmeniaArubaAustraliaAustriaAzerbaijanBahamas, TheBahrainBangladeshBarbadosBelarusBelgiumBelizeBeninBermudaBhutanBoliviaBosnia and HerzegovinaBotswanaBrazilBritish Virgin IslandsBrunei DarussalamBulgariaBurkina FasoBurundiCabo VerdeCambodiaCameroonCanadaCaribbean small statesCayman IslandsCentral African RepublicCentral Europe and the BalticsChadChileChinaColombiaComorosCongo, Dem. Rep.Congo, Rep.Costa RicaCote d'IvoireCroatiaCubaCyprusCzech RepublicDenmarkDjiboutiDominicaDominican RepublicEarly-demographic dividendEast Asia & PacificEast Asia & Pacific (excluding high income)East Asia & Pacific (IDA & IBRD countries)EcuadorEgypt, Arab Rep.El SalvadorEquatorial GuineaEritreaEstoniaEthiopiaEuro areaEurope & Central AsiaEurope & Central Asia (excluding high income)Europe & Central Asia (IDA & IBRD countries)European UnionFaroe IslandsFijiFinlandFragile and conflict affected situationsFranceFrench PolynesiaGabonGambia, TheGeorgiaGermanyGhanaGibraltarGreeceGreenlandGrenadaGuamGuatemalaGuineaGuinea-BissauGuyanaHaitiHeavily indebted poor countries (HIPC)High incomeHondurasHong Kong SAR, ChinaHungaryIBRD onlyIcelandIDA & IBRD totalIDA blendIDA onlyIDA totalIndiaIndonesiaIran, Islamic Rep.IraqIrelandIsraelItalyJamaicaJapanJordanKazakhstanKenyaKiribatiKorea, Dem. People’s Rep.Korea, Rep.KuwaitKyrgyz RepublicLao PDRLate-demographic dividendLatin America & Caribbean Latin America & Caribbean (excluding high income)Latin America & the Caribbean (IDA & IBRD countries)LatviaLeast developed countries: UN classificationLebanonLesothoLiberiaLibyaLithuaniaLow & middle incomeLow incomeLower middle incomeLuxembourgMacao SAR, ChinaMacedonia, FYRMadagascarMalawiMalaysiaMaldivesMaliMaltaMarshall IslandsMauritaniaMauritiusMexicoMicronesia, Fed. Sts.Middle East & North AfricaMiddle East & North Africa (excluding high income)Middle East & North Africa (IDA & IBRD countries)Middle incomeMoldovaMongoliaMoroccoMozambiqueMyanmarNamibiaNauruNepalNetherlandsNew CaledoniaNew ZealandNicaraguaNigerNigeriaNorth AmericaNorthern Mariana IslandsNorwayOECD membersOmanOther small statesPacific island small statesPakistanPalauPanamaPapua New GuineaParaguayPeruPhilippinesPolandPortugalPost-demographic dividendPre-demographic dividendPuerto RicoQatarRomaniaRussian FederationRwandaSamoaSao Tome and PrincipeSaudi ArabiaSenegalSerbiaSeychellesSierra LeoneSingaporeSlovak RepublicSloveniaSmall statesSolomon IslandsSomaliaSouth AfricaSouth AsiaSouth Asia (IDA & IBRD)SpainSri LankaSt. Kitts and NevisSt. LuciaSt. Vincent and the GrenadinesSub-Saharan Africa Sub-Saharan Africa (excluding high income)Sub-Saharan Africa (IDA & IBRD countries)SudanSurinameSwazilandSwedenSwitzerlandSyrian Arab RepublicTajikistanTanzaniaThailandTimor-LesteTogoTongaTrinidad and TobagoTunisiaTurkeyTurkmenistanTurks and Caicos IslandsTuvaluUgandaUkraineUnited Arab EmiratesUnited KingdomUnited StatesUpper middle incomeUruguayUzbekistanVanuatuVenezuela, RBVietnamVirgin Islands (U.S.)WorldYemen, Rep.ZambiaZimbabwe Timeline:
This timeline shows a graph from 1971 to 2009 of East Asia & Pacific (excluding high income). No data until 1970. Number of actual observations by date: 39.
Source name:
World Development Indicators
Source organization:
World Bank staff estimates from original source: European Commission, Joint Research Centre (JRC)/Netherlands Environmental Assessment Agency (PBL). Emission Database for Global Atmospheric Research (EDGAR): http://edgar.jrc.ec.europa.eu/.
Categories, topics:
Energy & Mining, Environment
Last updated:
apr 23, 2017
Indicators value changes by year
Minimum:
16.134
jan 1, 1973
Maximum:
41.354
jan 1, 2009
At the date of observation
Value
Absolute change
Change from previous value
jan 1, 1971
16.619
+16.619
0.0%
jan 1, 1972
16.733
+0.114
0.69%
jan 1, 1973
16.134
-0.599
-3.58%
jan 1, 1974
16.819
+0.684
4.24%
jan 1, 1975
17.738
+0.919
5.46%
jan 1, 1976
19.292
+1.555
8.77%
jan 1, 1977
19.217
-0.075
-0.39%
jan 1, 1978
19.904
+0.687
3.57%
jan 1, 1979
22.395
+2.491
12.51%
jan 1, 1980
22.81
+0.415
1.85%
jan 1, 1981
21.847
-0.963
-4.22%
jan 1, 1982
22.517
+0.669
3.06%
jan 1, 1983
18.889
-3.628
-16.11%
jan 1, 1984
21.767
+2.878
15.24%
jan 1, 1985
25.48
+3.713
17.06%
jan 1, 1986
26.398
+0.918
3.6%
jan 1, 1987
25.417
-0.981
-3.72%
jan 1, 1988
23.686
-1.731
-6.81%
jan 1, 1989
27.892
+4.206
17.76%
jan 1, 1990
28.752
+0.86
3.08%
jan 1, 1991
28.029
-0.723
-2.51%
jan 1, 1992
25.658
-2.371
-8.46%
jan 1, 1993
25.511
-0.147
-0.57%
jan 1, 1994
28.853
+3.343
13.1%
jan 1, 1995
27.306
-1.547
-5.36%
jan 1, 1996
30.855
+3.548
12.99%
jan 1, 1997
32.084
+1.23
3.99%
jan 1, 1998
22.211
-9.874
-30.77%
jan 1, 1999
29.286
+7.075
31.86%
jan 1, 2000
30.421
+1.136
3.88%
jan 1, 2001
31.622
+1.201
3.95%
jan 1, 2002
30.919
-0.703
-2.22%
jan 1, 2003
29.983
-0.937
-3.03%
jan 1, 2004
35.062
+5.08
16.94%
jan 1, 2005
35.905
+0.843
2.4%
jan 1, 2006
36.848
+0.943
2.63%
jan 1, 2007
34.561
-2.287
-6.21%
jan 1, 2008
39.756
+5.195
15.03%
jan 1, 2009
41.354
+1.598
4.02%
Ranking of countries by current statistics by years


Comments: