29
/
en
AIzaSyAYiBZKx7MnpbEhh9jyipgxe19OcubqV5w
April 1, 2024
145587
Guinea
GIN
true
2
1
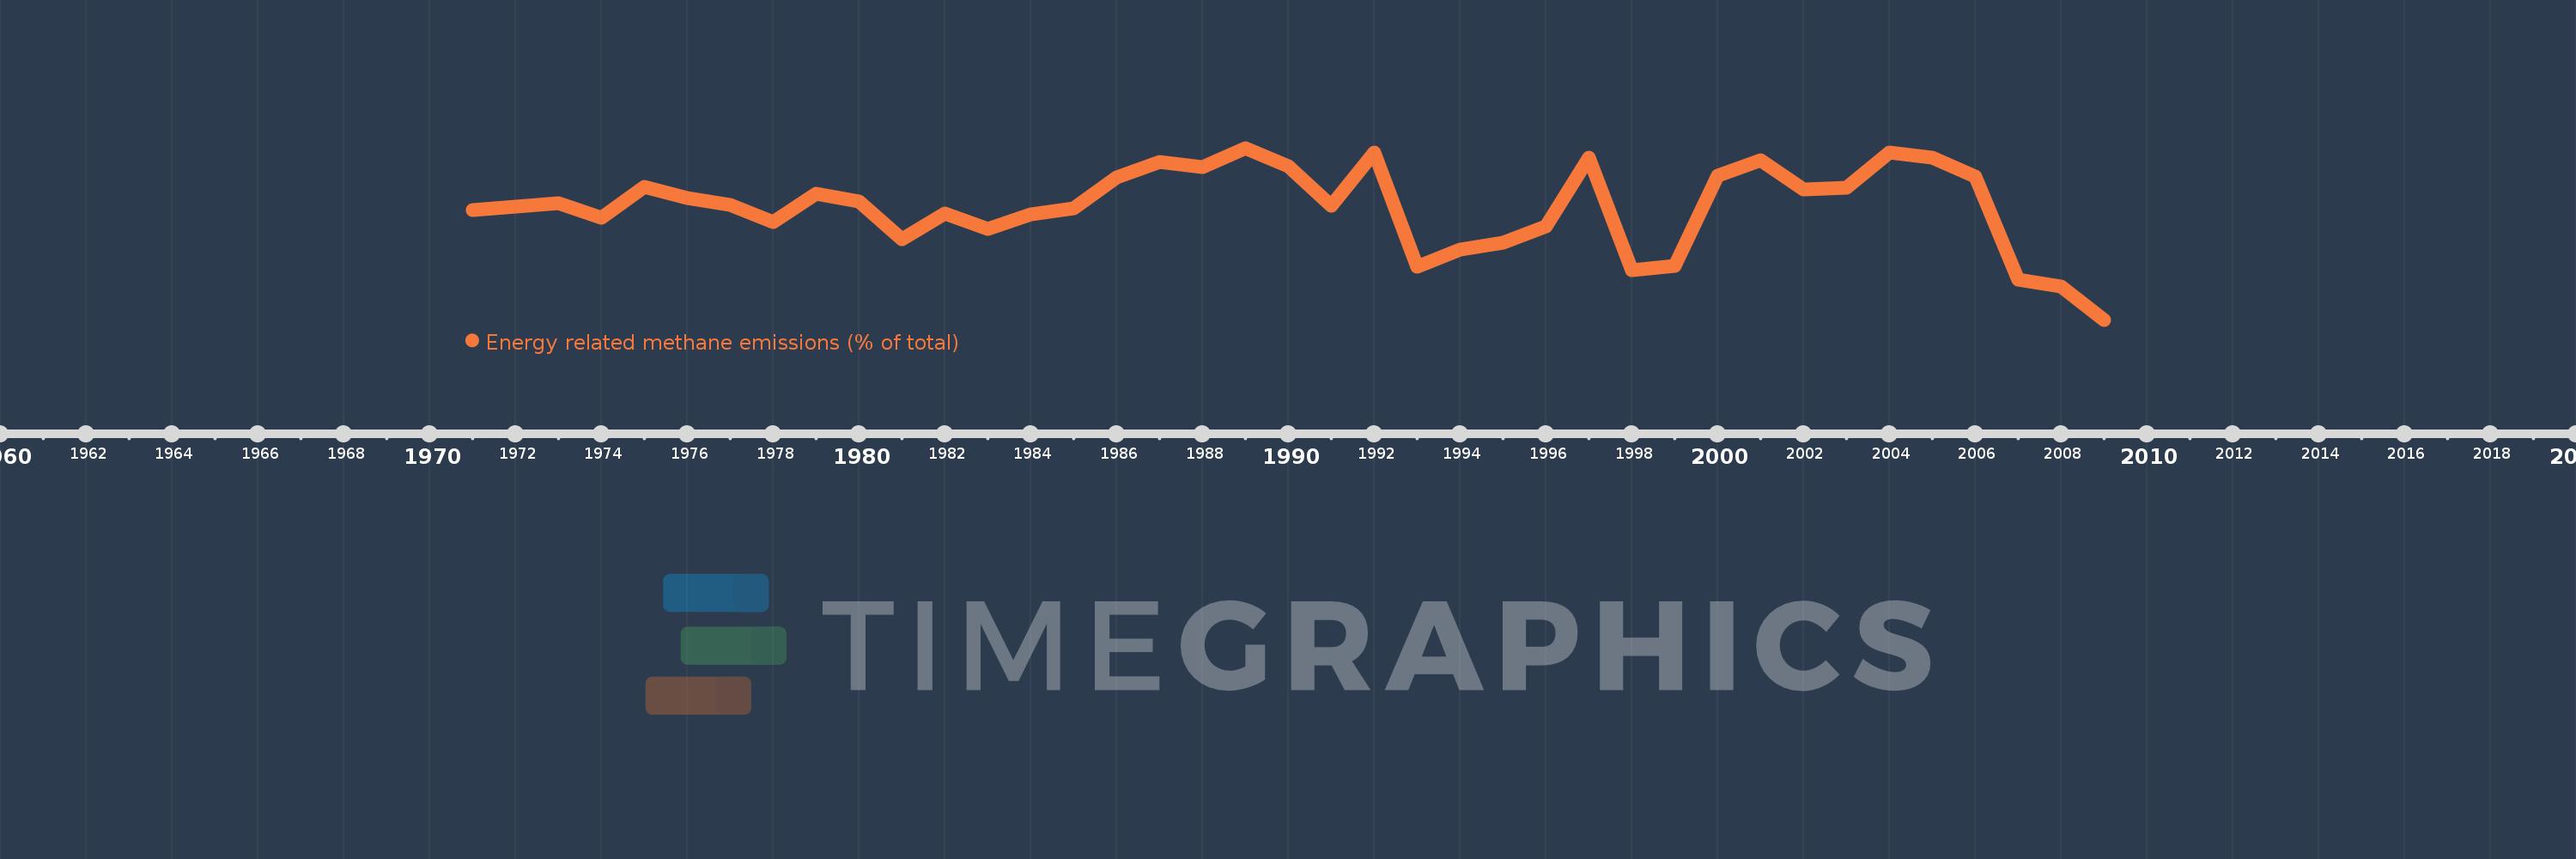
Energy related methane emissions (% of total)
2009,2008,2007,2006,2005,2004,2003,2002,2001,2000,1999,1998,1997,1996,1995,1994,1993,1992,1991,1990,1989,1988,1987,1986,1985,1984,1983,1982,1981,1980,1979,1978,1977,1976,1975,1974,1973,1972,1971
This statistics in other country:
AfghanistanAlbaniaAlgeriaAmerican SamoaAngolaAntigua and BarbudaArab WorldArgentinaArmeniaArubaAustraliaAustriaAzerbaijanBahamas, TheBahrainBangladeshBarbadosBelarusBelgiumBelizeBeninBermudaBhutanBoliviaBosnia and HerzegovinaBotswanaBrazilBritish Virgin IslandsBrunei DarussalamBulgariaBurkina FasoBurundiCabo VerdeCambodiaCameroonCanadaCaribbean small statesCayman IslandsCentral African RepublicCentral Europe and the BalticsChadChileChinaColombiaComorosCongo, Dem. Rep.Congo, Rep.Costa RicaCote d'IvoireCroatiaCubaCyprusCzech RepublicDenmarkDjiboutiDominicaDominican RepublicEarly-demographic dividendEast Asia & PacificEast Asia & Pacific (excluding high income)East Asia & Pacific (IDA & IBRD countries)EcuadorEgypt, Arab Rep.El SalvadorEquatorial GuineaEritreaEstoniaEthiopiaEuro areaEurope & Central AsiaEurope & Central Asia (excluding high income)Europe & Central Asia (IDA & IBRD countries)European UnionFaroe IslandsFijiFinlandFragile and conflict affected situationsFranceFrench PolynesiaGabonGambia, TheGeorgiaGermanyGhanaGibraltarGreeceGreenlandGrenadaGuamGuatemalaGuineaGuinea-BissauGuyanaHaitiHeavily indebted poor countries (HIPC)High incomeHondurasHong Kong SAR, ChinaHungaryIBRD onlyIcelandIDA & IBRD totalIDA blendIDA onlyIDA totalIndiaIndonesiaIran, Islamic Rep.IraqIrelandIsraelItalyJamaicaJapanJordanKazakhstanKenyaKiribatiKorea, Dem. People’s Rep.Korea, Rep.KuwaitKyrgyz RepublicLao PDRLate-demographic dividendLatin America & Caribbean Latin America & Caribbean (excluding high income)Latin America & the Caribbean (IDA & IBRD countries)LatviaLeast developed countries: UN classificationLebanonLesothoLiberiaLibyaLithuaniaLow & middle incomeLow incomeLower middle incomeLuxembourgMacao SAR, ChinaMacedonia, FYRMadagascarMalawiMalaysiaMaldivesMaliMaltaMarshall IslandsMauritaniaMauritiusMexicoMicronesia, Fed. Sts.Middle East & North AfricaMiddle East & North Africa (excluding high income)Middle East & North Africa (IDA & IBRD countries)Middle incomeMoldovaMongoliaMoroccoMozambiqueMyanmarNamibiaNauruNepalNetherlandsNew CaledoniaNew ZealandNicaraguaNigerNigeriaNorth AmericaNorthern Mariana IslandsNorwayOECD membersOmanOther small statesPacific island small statesPakistanPalauPanamaPapua New GuineaParaguayPeruPhilippinesPolandPortugalPost-demographic dividendPre-demographic dividendPuerto RicoQatarRomaniaRussian FederationRwandaSamoaSao Tome and PrincipeSaudi ArabiaSenegalSerbiaSeychellesSierra LeoneSingaporeSlovak RepublicSloveniaSmall statesSolomon IslandsSomaliaSouth AfricaSouth AsiaSouth Asia (IDA & IBRD)SpainSri LankaSt. Kitts and NevisSt. LuciaSt. Vincent and the GrenadinesSub-Saharan Africa Sub-Saharan Africa (excluding high income)Sub-Saharan Africa (IDA & IBRD countries)SudanSurinameSwazilandSwedenSwitzerlandSyrian Arab RepublicTajikistanTanzaniaThailandTimor-LesteTogoTongaTrinidad and TobagoTunisiaTurkeyTurkmenistanTurks and Caicos IslandsTuvaluUgandaUkraineUnited Arab EmiratesUnited KingdomUnited StatesUpper middle incomeUruguayUzbekistanVanuatuVenezuela, RBVietnamVirgin Islands (U.S.)WorldYemen, Rep.ZambiaZimbabwe Timeline:
This timeline shows a graph from 1971 to 2009 of Guinea. No data until 1970. Number of actual observations by date: 39.
Source name:
World Development Indicators
Source organization:
World Bank staff estimates from original source: European Commission, Joint Research Centre (JRC)/Netherlands Environmental Assessment Agency (PBL). Emission Database for Global Atmospheric Research (EDGAR): http://edgar.jrc.ec.europa.eu/.
Categories, topics:
Energy & Mining, Environment
Last updated:
apr 23, 2017
Indicators value changes by year
Maximum:
16.919
jan 1, 1989
At the date of observation
Value
Absolute change
Change from previous value
jan 1, 1971
12.465
+12.465
0.0%
jan 1, 1972
12.753
+0.288
2.31%
jan 1, 1973
12.982
+0.229
1.8%
jan 1, 1974
11.937
-1.045
-8.05%
jan 1, 1975
14.136
+2.199
18.42%
jan 1, 1976
13.347
-0.789
-5.58%
jan 1, 1977
12.845
-0.503
-3.77%
jan 1, 1978
11.612
-1.233
-9.6%
jan 1, 1979
13.648
+2.037
17.54%
jan 1, 1980
13.099
-0.549
-4.02%
jan 1, 1981
10.435
-2.665
-20.34%
jan 1, 1982
12.278
+1.844
17.67%
jan 1, 1983
11.167
-1.111
-9.05%
jan 1, 1984
12.21
+1.043
9.34%
jan 1, 1985
12.605
+0.395
3.24%
jan 1, 1986
14.803
+2.198
17.44%
jan 1, 1987
15.919
+1.116
7.54%
jan 1, 1988
15.553
-0.366
-2.3%
jan 1, 1989
16.919
+1.366
8.78%
jan 1, 1990
15.62
-1.299
-7.68%
jan 1, 1991
12.798
-2.822
-18.07%
jan 1, 1992
16.621
+3.823
29.87%
jan 1, 1993
8.423
-8.198
-49.32%
jan 1, 1994
9.654
+1.231
14.61%
jan 1, 1995
10.165
+0.511
5.29%
jan 1, 1996
11.346
+1.181
11.62%
jan 1, 1997
16.202
+4.855
42.79%
jan 1, 1998
8.204
-7.998
-49.36%
jan 1, 1999
8.526
+0.322
3.92%
jan 1, 2000
14.954
+6.429
75.41%
jan 1, 2001
16.02
+1.066
7.13%
jan 1, 2002
13.949
-2.072
-12.93%
jan 1, 2003
14.097
+0.148
1.06%
jan 1, 2004
16.571
+2.474
17.55%
jan 1, 2005
16.218
-0.353
-2.13%
jan 1, 2006
14.896
-1.322
-8.15%
jan 1, 2007
7.531
-7.365
-49.44%
jan 1, 2008
7.019
-0.512
-6.8%
jan 1, 2009
4.674
-2.345
-33.41%
Ranking of countries by current statistics by years


Comments: