29
/
en
AIzaSyAYiBZKx7MnpbEhh9jyipgxe19OcubqV5w
April 1, 2024
222090
Peru
PER
true
2
1
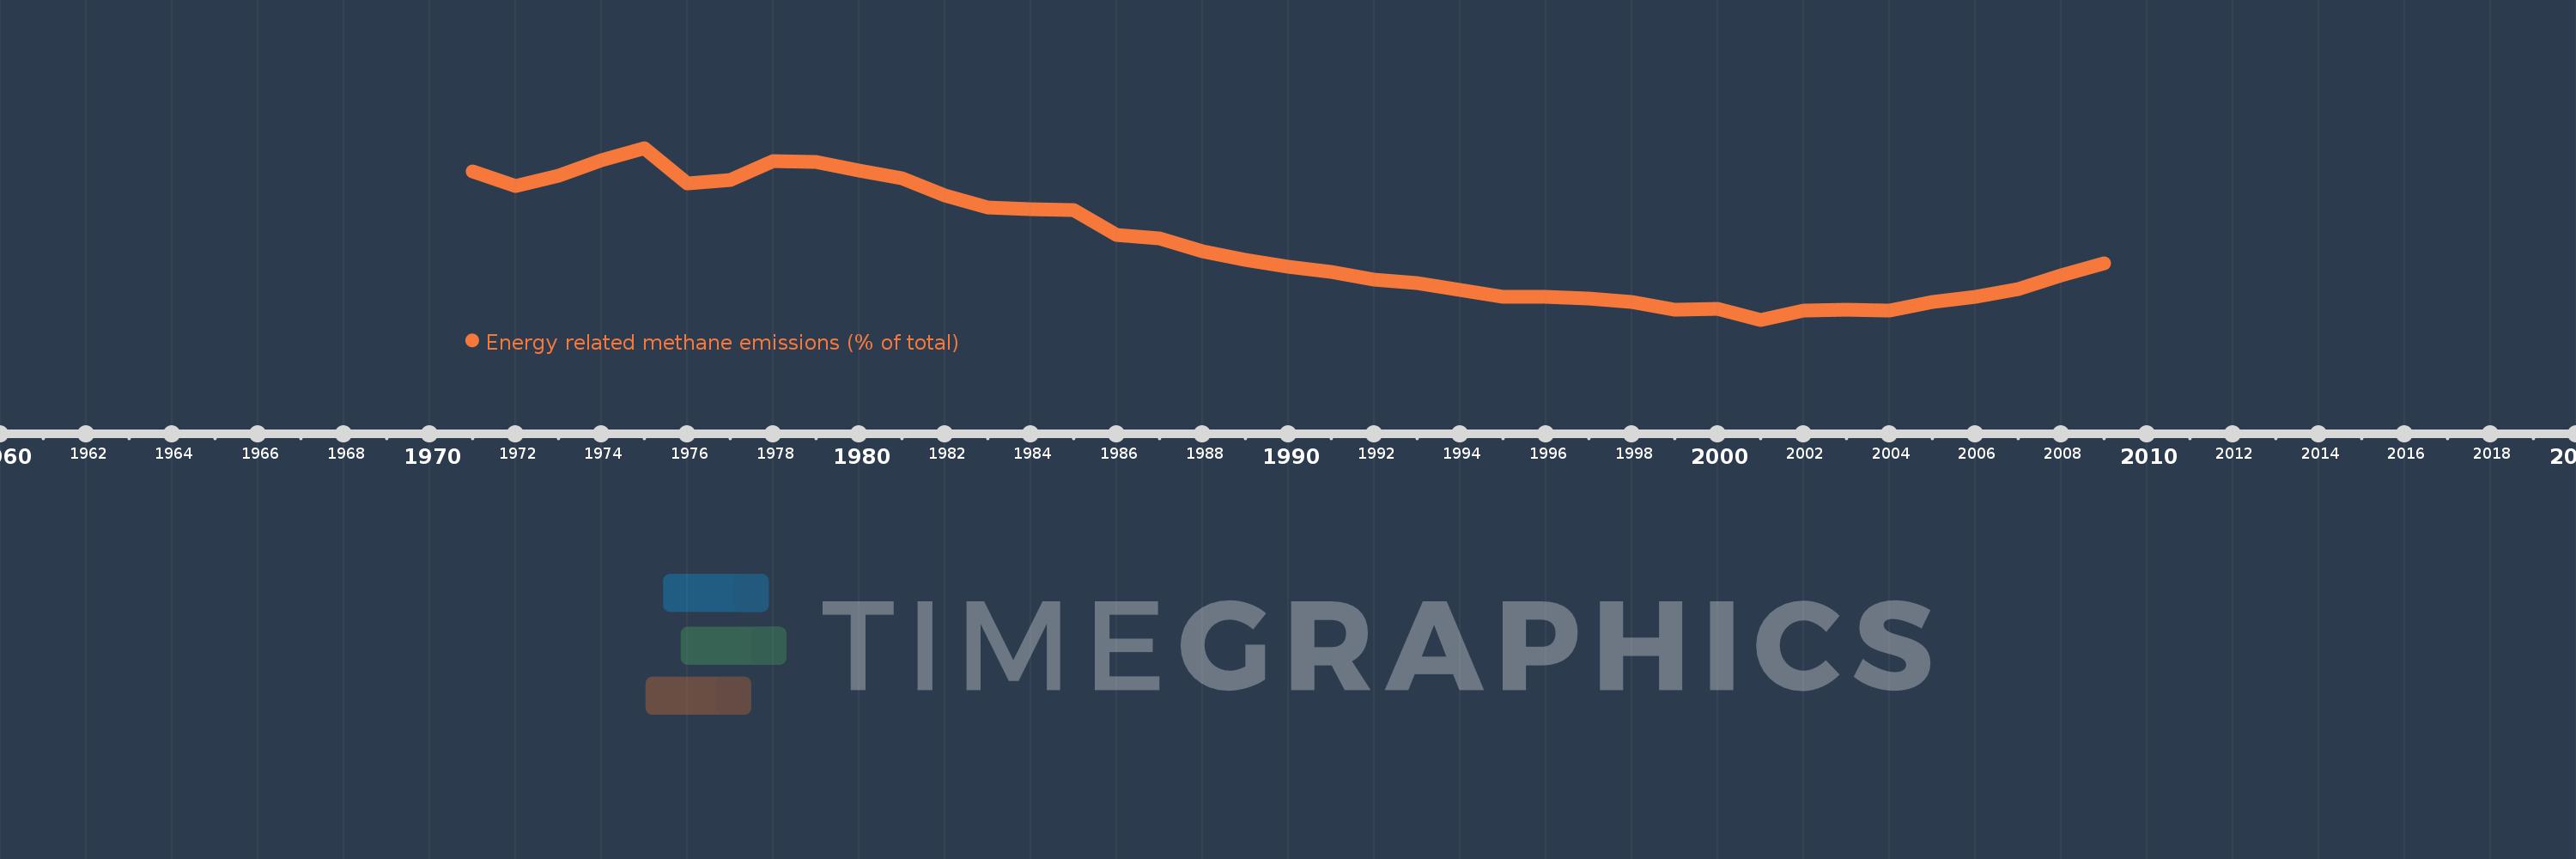
Energy related methane emissions (% of total)
2009,2008,2007,2006,2005,2004,2003,2002,2001,2000,1999,1998,1997,1996,1995,1994,1993,1992,1991,1990,1989,1988,1987,1986,1985,1984,1983,1982,1981,1980,1979,1978,1977,1976,1975,1974,1973,1972,1971
This statistics in other country:
AfghanistanAlbaniaAlgeriaAmerican SamoaAngolaAntigua and BarbudaArab WorldArgentinaArmeniaArubaAustraliaAustriaAzerbaijanBahamas, TheBahrainBangladeshBarbadosBelarusBelgiumBelizeBeninBermudaBhutanBoliviaBosnia and HerzegovinaBotswanaBrazilBritish Virgin IslandsBrunei DarussalamBulgariaBurkina FasoBurundiCabo VerdeCambodiaCameroonCanadaCaribbean small statesCayman IslandsCentral African RepublicCentral Europe and the BalticsChadChileChinaColombiaComorosCongo, Dem. Rep.Congo, Rep.Costa RicaCote d'IvoireCroatiaCubaCyprusCzech RepublicDenmarkDjiboutiDominicaDominican RepublicEarly-demographic dividendEast Asia & PacificEast Asia & Pacific (excluding high income)East Asia & Pacific (IDA & IBRD countries)EcuadorEgypt, Arab Rep.El SalvadorEquatorial GuineaEritreaEstoniaEthiopiaEuro areaEurope & Central AsiaEurope & Central Asia (excluding high income)Europe & Central Asia (IDA & IBRD countries)European UnionFaroe IslandsFijiFinlandFragile and conflict affected situationsFranceFrench PolynesiaGabonGambia, TheGeorgiaGermanyGhanaGibraltarGreeceGreenlandGrenadaGuamGuatemalaGuineaGuinea-BissauGuyanaHaitiHeavily indebted poor countries (HIPC)High incomeHondurasHong Kong SAR, ChinaHungaryIBRD onlyIcelandIDA & IBRD totalIDA blendIDA onlyIDA totalIndiaIndonesiaIran, Islamic Rep.IraqIrelandIsraelItalyJamaicaJapanJordanKazakhstanKenyaKiribatiKorea, Dem. People’s Rep.Korea, Rep.KuwaitKyrgyz RepublicLao PDRLate-demographic dividendLatin America & Caribbean Latin America & Caribbean (excluding high income)Latin America & the Caribbean (IDA & IBRD countries)LatviaLeast developed countries: UN classificationLebanonLesothoLiberiaLibyaLithuaniaLow & middle incomeLow incomeLower middle incomeLuxembourgMacao SAR, ChinaMacedonia, FYRMadagascarMalawiMalaysiaMaldivesMaliMaltaMarshall IslandsMauritaniaMauritiusMexicoMicronesia, Fed. Sts.Middle East & North AfricaMiddle East & North Africa (excluding high income)Middle East & North Africa (IDA & IBRD countries)Middle incomeMoldovaMongoliaMoroccoMozambiqueMyanmarNamibiaNauruNepalNetherlandsNew CaledoniaNew ZealandNicaraguaNigerNigeriaNorth AmericaNorthern Mariana IslandsNorwayOECD membersOmanOther small statesPacific island small statesPakistanPalauPanamaPapua New GuineaParaguayPeruPhilippinesPolandPortugalPost-demographic dividendPre-demographic dividendPuerto RicoQatarRomaniaRussian FederationRwandaSamoaSao Tome and PrincipeSaudi ArabiaSenegalSerbiaSeychellesSierra LeoneSingaporeSlovak RepublicSloveniaSmall statesSolomon IslandsSomaliaSouth AfricaSouth AsiaSouth Asia (IDA & IBRD)SpainSri LankaSt. Kitts and NevisSt. LuciaSt. Vincent and the GrenadinesSub-Saharan Africa Sub-Saharan Africa (excluding high income)Sub-Saharan Africa (IDA & IBRD countries)SudanSurinameSwazilandSwedenSwitzerlandSyrian Arab RepublicTajikistanTanzaniaThailandTimor-LesteTogoTongaTrinidad and TobagoTunisiaTurkeyTurkmenistanTurks and Caicos IslandsTuvaluUgandaUkraineUnited Arab EmiratesUnited KingdomUnited StatesUpper middle incomeUruguayUzbekistanVanuatuVenezuela, RBVietnamVirgin Islands (U.S.)WorldYemen, Rep.ZambiaZimbabwe Timeline:
This timeline shows a graph from 1971 to 2009 of Peru. No data until 1970. Number of actual observations by date: 39.
Source name:
World Development Indicators
Source organization:
World Bank staff estimates from original source: European Commission, Joint Research Centre (JRC)/Netherlands Environmental Assessment Agency (PBL). Emission Database for Global Atmospheric Research (EDGAR): http://edgar.jrc.ec.europa.eu/.
Categories, topics:
Energy & Mining, Environment
Last updated:
apr 23, 2017
Indicators value changes by year
Maximum:
20.519
jan 1, 1975
At the date of observation
Value
Absolute change
Change from previous value
jan 1, 1971
19.021
+19.021
0.0%
jan 1, 1972
18.048
-0.973
-5.12%
jan 1, 1973
18.718
+0.671
3.72%
jan 1, 1974
19.718
+1.0
5.34%
jan 1, 1975
20.519
+0.801
4.06%
jan 1, 1976
18.188
-2.33
-11.36%
jan 1, 1977
18.46
+0.272
1.49%
jan 1, 1978
19.681
+1.222
6.62%
jan 1, 1979
19.629
-0.052
-0.26%
jan 1, 1980
19.034
-0.595
-3.03%
jan 1, 1981
18.552
-0.483
-2.54%
jan 1, 1982
17.403
-1.149
-6.19%
jan 1, 1983
16.627
-0.776
-4.46%
jan 1, 1984
16.554
-0.073
-0.44%
jan 1, 1985
16.489
-0.065
-0.39%
jan 1, 1986
14.855
-1.634
-9.91%
jan 1, 1987
14.662
-0.193
-1.3%
jan 1, 1988
13.813
-0.849
-5.79%
jan 1, 1989
13.243
-0.569
-4.12%
jan 1, 1990
12.802
-0.441
-3.33%
jan 1, 1991
12.462
-0.34
-2.65%
jan 1, 1992
11.952
-0.51
-4.09%
jan 1, 1993
11.705
-0.247
-2.07%
jan 1, 1994
11.304
-0.402
-3.43%
jan 1, 1995
10.83
-0.473
-4.19%
jan 1, 1996
10.81
-0.02
-0.18%
jan 1, 1997
10.735
-0.076
-0.7%
jan 1, 1998
10.488
-0.247
-2.3%
jan 1, 1999
10.016
-0.472
-4.5%
jan 1, 2000
10.034
+0.018
0.18%
jan 1, 2001
9.345
-0.689
-6.87%
jan 1, 2002
9.948
+0.604
6.46%
jan 1, 2003
10.018
+0.07
0.7%
jan 1, 2004
9.955
-0.063
-0.63%
jan 1, 2005
10.516
+0.56
5.63%
jan 1, 2006
10.858
+0.342
3.25%
jan 1, 2007
11.317
+0.459
4.23%
jan 1, 2008
12.211
+0.894
7.9%
jan 1, 2009
12.995
+0.784
6.42%
Ranking of countries by current statistics by years


Comments: