29
/
en
AIzaSyAYiBZKx7MnpbEhh9jyipgxe19OcubqV5w
April 1, 2024
233570
Sao Tome and Principe
STP
true
2
1
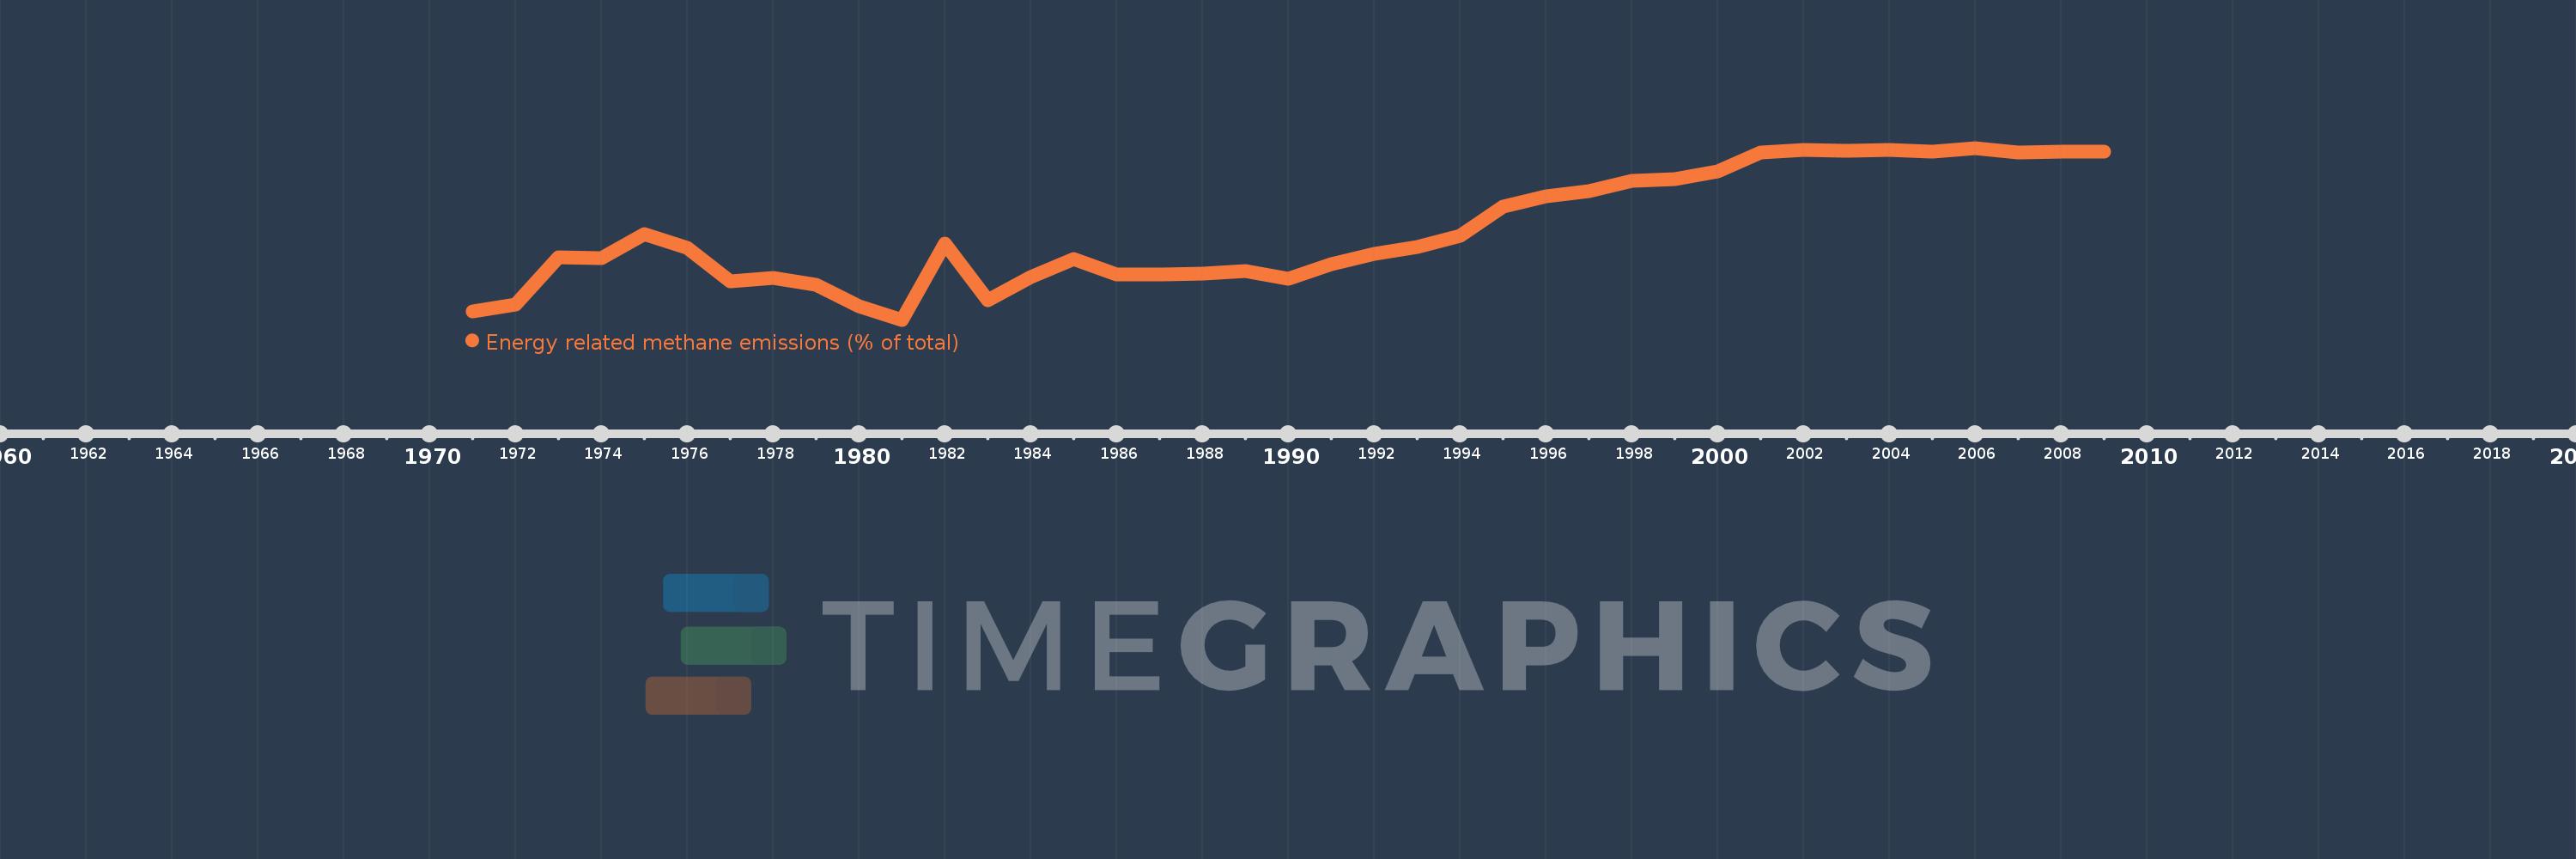
Energy related methane emissions (% of total)
2009,2008,2007,2006,2005,2004,2003,2002,2001,2000,1999,1998,1997,1996,1995,1994,1993,1992,1991,1990,1989,1988,1987,1986,1985,1984,1983,1982,1981,1980,1979,1978,1977,1976,1975,1974,1973,1972,1971
This statistics in other country:
AfghanistanAlbaniaAlgeriaAmerican SamoaAngolaAntigua and BarbudaArab WorldArgentinaArmeniaArubaAustraliaAustriaAzerbaijanBahamas, TheBahrainBangladeshBarbadosBelarusBelgiumBelizeBeninBermudaBhutanBoliviaBosnia and HerzegovinaBotswanaBrazilBritish Virgin IslandsBrunei DarussalamBulgariaBurkina FasoBurundiCabo VerdeCambodiaCameroonCanadaCaribbean small statesCayman IslandsCentral African RepublicCentral Europe and the BalticsChadChileChinaColombiaComorosCongo, Dem. Rep.Congo, Rep.Costa RicaCote d'IvoireCroatiaCubaCyprusCzech RepublicDenmarkDjiboutiDominicaDominican RepublicEarly-demographic dividendEast Asia & PacificEast Asia & Pacific (excluding high income)East Asia & Pacific (IDA & IBRD countries)EcuadorEgypt, Arab Rep.El SalvadorEquatorial GuineaEritreaEstoniaEthiopiaEuro areaEurope & Central AsiaEurope & Central Asia (excluding high income)Europe & Central Asia (IDA & IBRD countries)European UnionFaroe IslandsFijiFinlandFragile and conflict affected situationsFranceFrench PolynesiaGabonGambia, TheGeorgiaGermanyGhanaGibraltarGreeceGreenlandGrenadaGuamGuatemalaGuineaGuinea-BissauGuyanaHaitiHeavily indebted poor countries (HIPC)High incomeHondurasHong Kong SAR, ChinaHungaryIBRD onlyIcelandIDA & IBRD totalIDA blendIDA onlyIDA totalIndiaIndonesiaIran, Islamic Rep.IraqIrelandIsraelItalyJamaicaJapanJordanKazakhstanKenyaKiribatiKorea, Dem. People’s Rep.Korea, Rep.KuwaitKyrgyz RepublicLao PDRLate-demographic dividendLatin America & Caribbean Latin America & Caribbean (excluding high income)Latin America & the Caribbean (IDA & IBRD countries)LatviaLeast developed countries: UN classificationLebanonLesothoLiberiaLibyaLithuaniaLow & middle incomeLow incomeLower middle incomeLuxembourgMacao SAR, ChinaMacedonia, FYRMadagascarMalawiMalaysiaMaldivesMaliMaltaMarshall IslandsMauritaniaMauritiusMexicoMicronesia, Fed. Sts.Middle East & North AfricaMiddle East & North Africa (excluding high income)Middle East & North Africa (IDA & IBRD countries)Middle incomeMoldovaMongoliaMoroccoMozambiqueMyanmarNamibiaNauruNepalNetherlandsNew CaledoniaNew ZealandNicaraguaNigerNigeriaNorth AmericaNorthern Mariana IslandsNorwayOECD membersOmanOther small statesPacific island small statesPakistanPalauPanamaPapua New GuineaParaguayPeruPhilippinesPolandPortugalPost-demographic dividendPre-demographic dividendPuerto RicoQatarRomaniaRussian FederationRwandaSamoaSao Tome and PrincipeSaudi ArabiaSenegalSerbiaSeychellesSierra LeoneSingaporeSlovak RepublicSloveniaSmall statesSolomon IslandsSomaliaSouth AfricaSouth AsiaSouth Asia (IDA & IBRD)SpainSri LankaSt. Kitts and NevisSt. LuciaSt. Vincent and the GrenadinesSub-Saharan Africa Sub-Saharan Africa (excluding high income)Sub-Saharan Africa (IDA & IBRD countries)SudanSurinameSwazilandSwedenSwitzerlandSyrian Arab RepublicTajikistanTanzaniaThailandTimor-LesteTogoTongaTrinidad and TobagoTunisiaTurkeyTurkmenistanTurks and Caicos IslandsTuvaluUgandaUkraineUnited Arab EmiratesUnited KingdomUnited StatesUpper middle incomeUruguayUzbekistanVanuatuVenezuela, RBVietnamVirgin Islands (U.S.)WorldYemen, Rep.ZambiaZimbabwe Timeline:
This timeline shows a graph from 1971 to 2009 of Sao Tome and Principe. No data until 1970. Number of actual observations by date: 39.
Source name:
World Development Indicators
Source organization:
World Bank staff estimates from original source: European Commission, Joint Research Centre (JRC)/Netherlands Environmental Assessment Agency (PBL). Emission Database for Global Atmospheric Research (EDGAR): http://edgar.jrc.ec.europa.eu/.
Categories, topics:
Energy & Mining, Environment
Last updated:
apr 23, 2017
Indicators value changes by year
Minimum:
34.369
jan 1, 1981
Maximum:
40.239
jan 1, 2006
At the date of observation
Value
Absolute change
Change from previous value
jan 1, 1971
34.655
+34.655
0.0%
jan 1, 1972
34.901
+0.245
0.71%
jan 1, 1973
36.517
+1.616
4.63%
jan 1, 1974
36.478
-0.039
-0.11%
jan 1, 1975
37.295
+0.817
2.24%
jan 1, 1976
36.828
-0.467
-1.25%
jan 1, 1977
35.667
-1.161
-3.15%
jan 1, 1978
35.8
+0.133
0.37%
jan 1, 1979
35.575
-0.225
-0.63%
jan 1, 1980
34.818
-0.757
-2.13%
jan 1, 1981
34.369
-0.449
-1.29%
jan 1, 1982
36.961
+2.592
7.54%
jan 1, 1983
35.038
-1.924
-5.21%
jan 1, 1984
35.83
+0.792
2.26%
jan 1, 1985
36.458
+0.629
1.76%
jan 1, 1986
35.907
-0.551
-1.51%
jan 1, 1987
35.91
+0.003
0.01%
jan 1, 1988
35.957
+0.047
0.13%
jan 1, 1989
36.044
+0.087
0.24%
jan 1, 1990
35.775
-0.27
-0.75%
jan 1, 1991
36.279
+0.504
1.41%
jan 1, 1992
36.606
+0.328
0.9%
jan 1, 1993
36.86
+0.254
0.69%
jan 1, 1994
37.248
+0.388
1.05%
jan 1, 1995
38.247
+1.0
2.68%
jan 1, 1996
38.584
+0.337
0.88%
jan 1, 1997
38.758
+0.174
0.45%
jan 1, 1998
39.116
+0.358
0.92%
jan 1, 1999
39.188
+0.072
0.18%
jan 1, 2000
39.438
+0.25
0.64%
jan 1, 2001
40.085
+0.647
1.64%
jan 1, 2002
40.184
+0.098
0.25%
jan 1, 2003
40.136
-0.047
-0.12%
jan 1, 2004
40.163
+0.027
0.07%
jan 1, 2005
40.124
-0.039
-0.1%
jan 1, 2006
40.239
+0.115
0.29%
jan 1, 2007
40.097
-0.142
-0.35%
jan 1, 2008
40.117
+0.02
0.05%
jan 1, 2009
40.118
+0.001
0.0%
Ranking of countries by current statistics by years


Comments: