29
/
en
AIzaSyAYiBZKx7MnpbEhh9jyipgxe19OcubqV5w
April 1, 2024
38918
IDA only
IDX
false
2
1
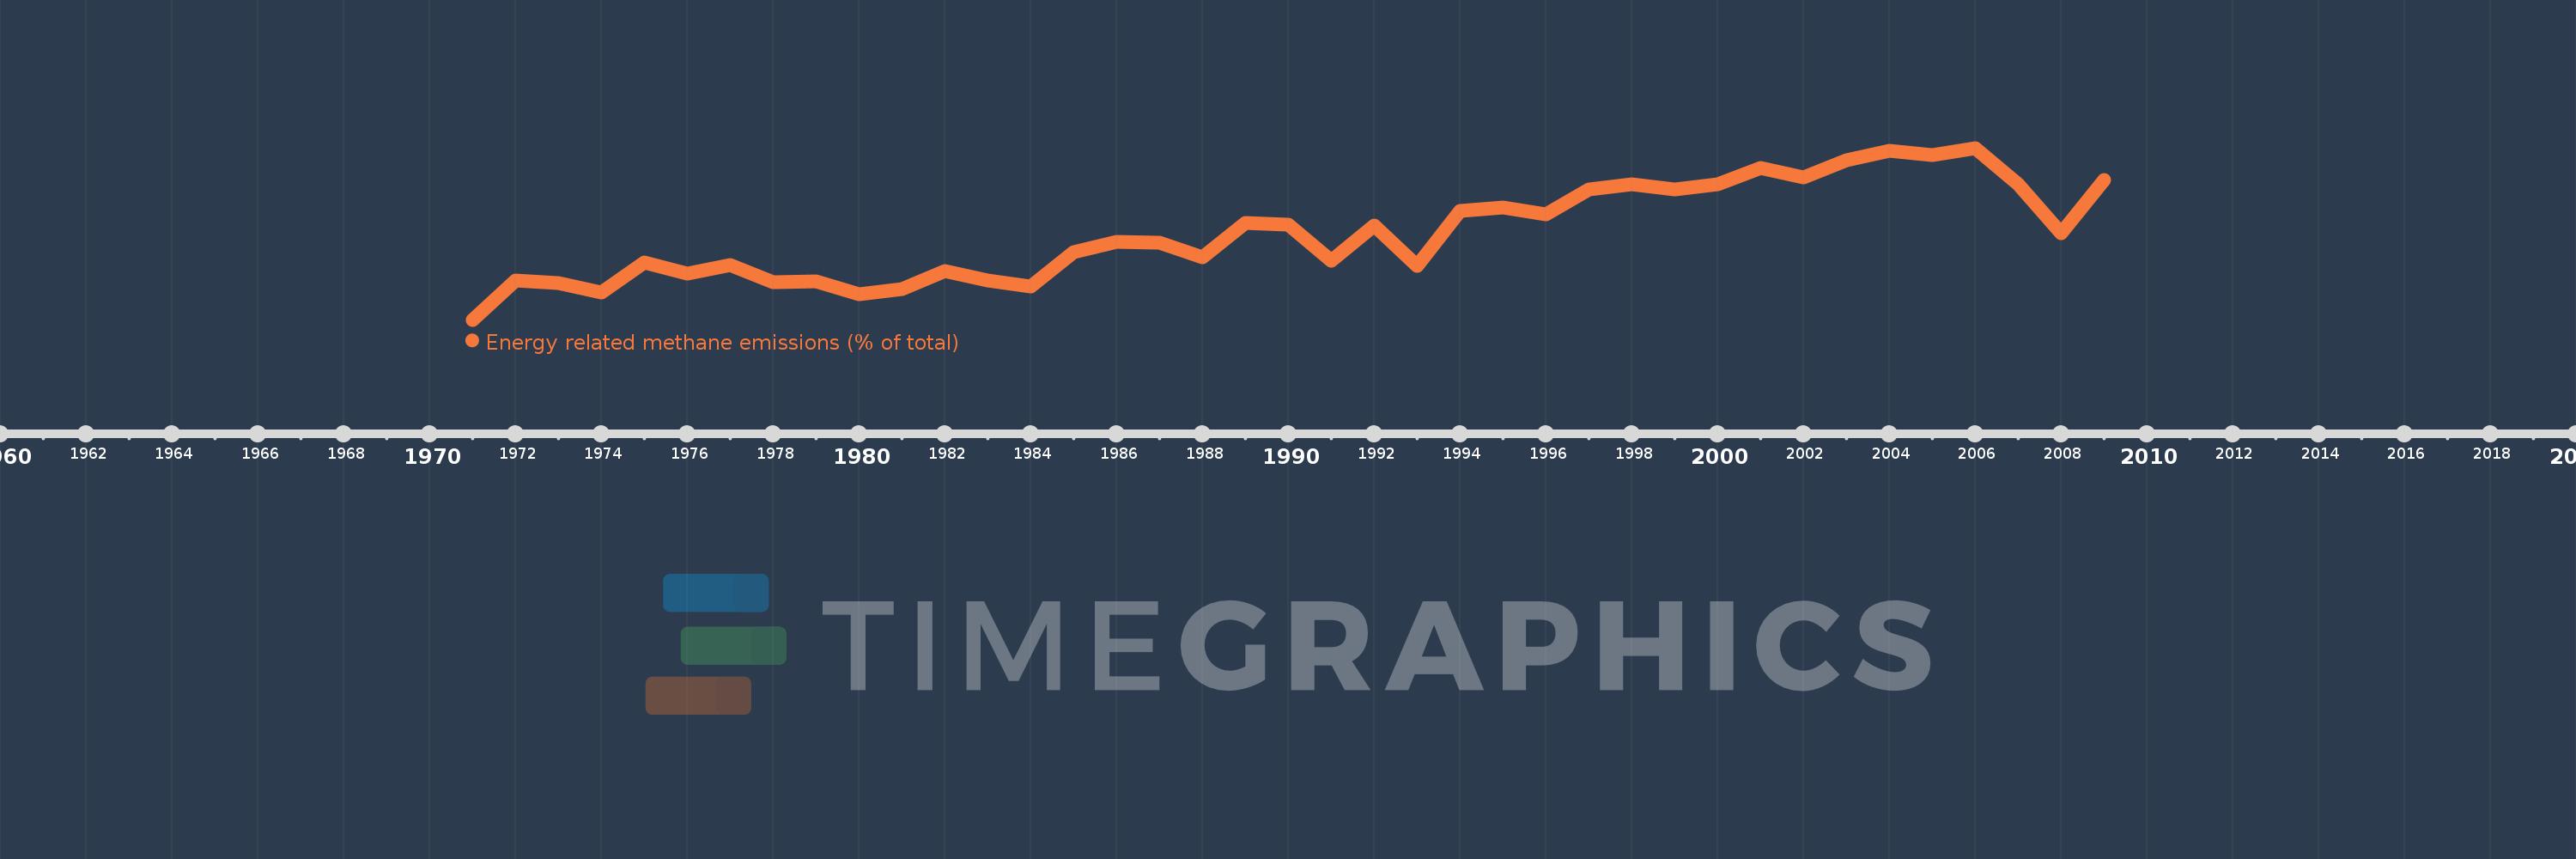
Energy related methane emissions (% of total)
2009,2008,2007,2006,2005,2004,2003,2002,2001,2000,1999,1998,1997,1996,1995,1994,1993,1992,1991,1990,1989,1988,1987,1986,1985,1984,1983,1982,1981,1980,1979,1978,1977,1976,1975,1974,1973,1972,1971
This statistics in other country:
AfghanistanAlbaniaAlgeriaAmerican SamoaAngolaAntigua and BarbudaArab WorldArgentinaArmeniaArubaAustraliaAustriaAzerbaijanBahamas, TheBahrainBangladeshBarbadosBelarusBelgiumBelizeBeninBermudaBhutanBoliviaBosnia and HerzegovinaBotswanaBrazilBritish Virgin IslandsBrunei DarussalamBulgariaBurkina FasoBurundiCabo VerdeCambodiaCameroonCanadaCaribbean small statesCayman IslandsCentral African RepublicCentral Europe and the BalticsChadChileChinaColombiaComorosCongo, Dem. Rep.Congo, Rep.Costa RicaCote d'IvoireCroatiaCubaCyprusCzech RepublicDenmarkDjiboutiDominicaDominican RepublicEarly-demographic dividendEast Asia & PacificEast Asia & Pacific (excluding high income)East Asia & Pacific (IDA & IBRD countries)EcuadorEgypt, Arab Rep.El SalvadorEquatorial GuineaEritreaEstoniaEthiopiaEuro areaEurope & Central AsiaEurope & Central Asia (excluding high income)Europe & Central Asia (IDA & IBRD countries)European UnionFaroe IslandsFijiFinlandFragile and conflict affected situationsFranceFrench PolynesiaGabonGambia, TheGeorgiaGermanyGhanaGibraltarGreeceGreenlandGrenadaGuamGuatemalaGuineaGuinea-BissauGuyanaHaitiHeavily indebted poor countries (HIPC)High incomeHondurasHong Kong SAR, ChinaHungaryIBRD onlyIcelandIDA & IBRD totalIDA blendIDA onlyIDA totalIndiaIndonesiaIran, Islamic Rep.IraqIrelandIsraelItalyJamaicaJapanJordanKazakhstanKenyaKiribatiKorea, Dem. People’s Rep.Korea, Rep.KuwaitKyrgyz RepublicLao PDRLate-demographic dividendLatin America & Caribbean Latin America & Caribbean (excluding high income)Latin America & the Caribbean (IDA & IBRD countries)LatviaLeast developed countries: UN classificationLebanonLesothoLiberiaLibyaLithuaniaLow & middle incomeLow incomeLower middle incomeLuxembourgMacao SAR, ChinaMacedonia, FYRMadagascarMalawiMalaysiaMaldivesMaliMaltaMarshall IslandsMauritaniaMauritiusMexicoMicronesia, Fed. Sts.Middle East & North AfricaMiddle East & North Africa (excluding high income)Middle East & North Africa (IDA & IBRD countries)Middle incomeMoldovaMongoliaMoroccoMozambiqueMyanmarNamibiaNauruNepalNetherlandsNew CaledoniaNew ZealandNicaraguaNigerNigeriaNorth AmericaNorthern Mariana IslandsNorwayOECD membersOmanOther small statesPacific island small statesPakistanPalauPanamaPapua New GuineaParaguayPeruPhilippinesPolandPortugalPost-demographic dividendPre-demographic dividendPuerto RicoQatarRomaniaRussian FederationRwandaSamoaSao Tome and PrincipeSaudi ArabiaSenegalSerbiaSeychellesSierra LeoneSingaporeSlovak RepublicSloveniaSmall statesSolomon IslandsSomaliaSouth AfricaSouth AsiaSouth Asia (IDA & IBRD)SpainSri LankaSt. Kitts and NevisSt. LuciaSt. Vincent and the GrenadinesSub-Saharan Africa Sub-Saharan Africa (excluding high income)Sub-Saharan Africa (IDA & IBRD countries)SudanSurinameSwazilandSwedenSwitzerlandSyrian Arab RepublicTajikistanTanzaniaThailandTimor-LesteTogoTongaTrinidad and TobagoTunisiaTurkeyTurkmenistanTurks and Caicos IslandsTuvaluUgandaUkraineUnited Arab EmiratesUnited KingdomUnited StatesUpper middle incomeUruguayUzbekistanVanuatuVenezuela, RBVietnamVirgin Islands (U.S.)WorldYemen, Rep.ZambiaZimbabwe Timeline:
This timeline shows a graph from 1971 to 2009 of IDA only. No data until 1970. Number of actual observations by date: 39.
Source name:
World Development Indicators
Source organization:
World Bank staff estimates from original source: European Commission, Joint Research Centre (JRC)/Netherlands Environmental Assessment Agency (PBL). Emission Database for Global Atmospheric Research (EDGAR): http://edgar.jrc.ec.europa.eu/.
Categories, topics:
Energy & Mining, Environment
Last updated:
apr 23, 2017
Indicators value changes by year
Maximum:
14.185
jan 1, 2006
At the date of observation
Value
Absolute change
Change from previous value
jan 1, 1971
6.354
+6.354
0.0%
jan 1, 1972
8.129
+1.775
27.93%
jan 1, 1973
8.038
-0.091
-1.12%
jan 1, 1974
7.592
-0.445
-5.54%
jan 1, 1975
8.971
+1.379
18.16%
jan 1, 1976
8.44
-0.531
-5.91%
jan 1, 1977
8.861
+0.421
4.99%
jan 1, 1978
8.06
-0.801
-9.04%
jan 1, 1979
8.099
+0.039
0.48%
jan 1, 1980
7.522
-0.577
-7.13%
jan 1, 1981
7.771
+0.249
3.31%
jan 1, 1982
8.568
+0.798
10.27%
jan 1, 1983
8.128
-0.44
-5.14%
jan 1, 1984
7.858
-0.27
-3.33%
jan 1, 1985
9.436
+1.578
20.09%
jan 1, 1986
9.896
+0.46
4.88%
jan 1, 1987
9.854
-0.043
-0.43%
jan 1, 1988
9.192
-0.662
-6.72%
jan 1, 1989
10.786
+1.594
17.34%
jan 1, 1990
10.676
-0.109
-1.01%
jan 1, 1991
9.046
-1.63
-15.27%
jan 1, 1992
10.658
+1.612
17.82%
jan 1, 1993
8.803
-1.855
-17.41%
jan 1, 1994
11.332
+2.529
28.73%
jan 1, 1995
11.47
+0.138
1.22%
jan 1, 1996
11.162
-0.308
-2.69%
jan 1, 1997
12.301
+1.139
10.21%
jan 1, 1998
12.545
+0.244
1.98%
jan 1, 1999
12.275
-0.27
-2.15%
jan 1, 2000
12.518
+0.243
1.98%
jan 1, 2001
13.26
+0.742
5.92%
jan 1, 2002
12.845
-0.415
-3.13%
jan 1, 2003
13.619
+0.774
6.02%
jan 1, 2004
14.064
+0.445
3.26%
jan 1, 2005
13.87
-0.193
-1.37%
jan 1, 2006
14.185
+0.315
2.27%
jan 1, 2007
12.529
-1.656
-11.68%
jan 1, 2008
10.301
-2.228
-17.78%
jan 1, 2009
12.709
+2.408
23.37%
Ranking of countries by current statistics by years


Comments: