29
/
en
AIzaSyAYiBZKx7MnpbEhh9jyipgxe19OcubqV5w
April 1, 2024
177600
Lesotho
LSO
true
2
1
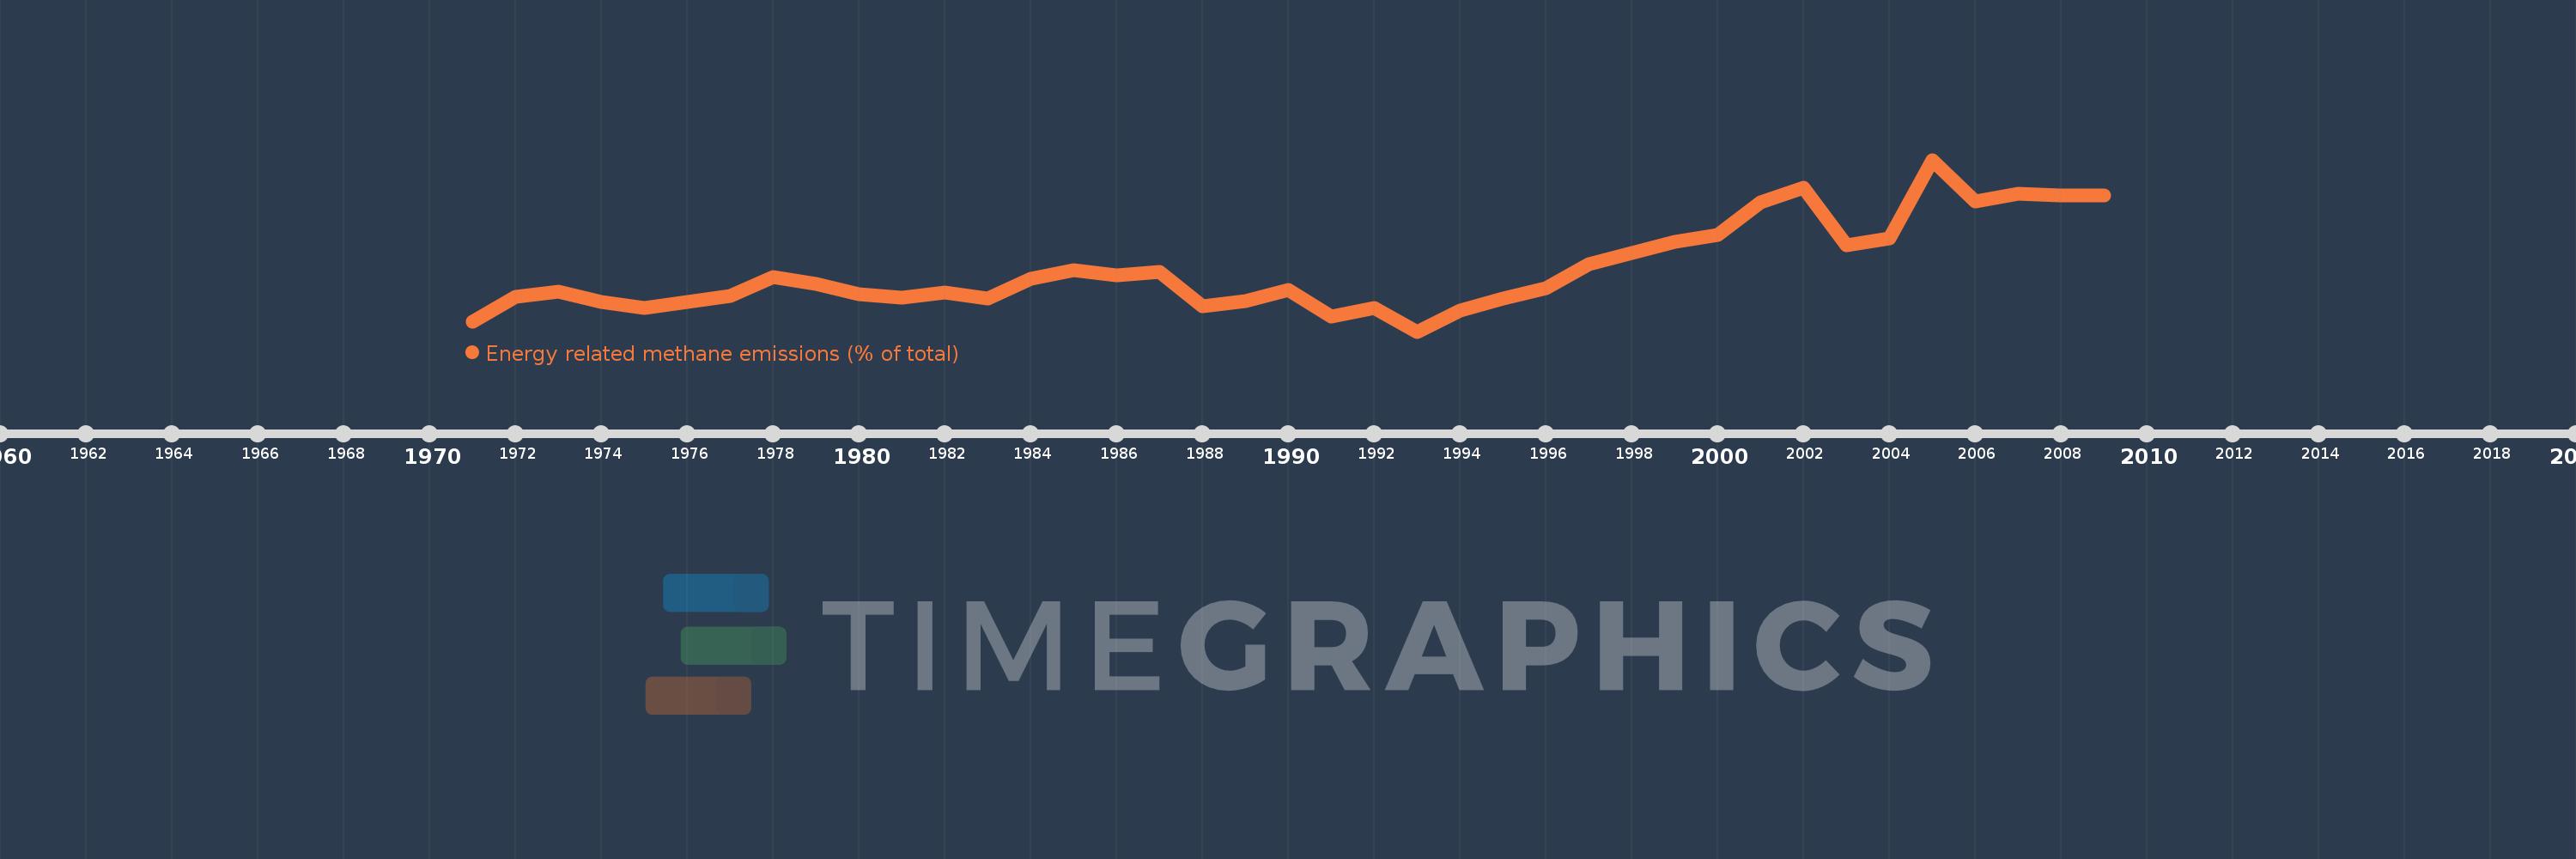
Energy related methane emissions (% of total)
2009,2008,2007,2006,2005,2004,2003,2002,2001,2000,1999,1998,1997,1996,1995,1994,1993,1992,1991,1990,1989,1988,1987,1986,1985,1984,1983,1982,1981,1980,1979,1978,1977,1976,1975,1974,1973,1972,1971
This statistics in other country:
AfghanistanAlbaniaAlgeriaAmerican SamoaAngolaAntigua and BarbudaArab WorldArgentinaArmeniaArubaAustraliaAustriaAzerbaijanBahamas, TheBahrainBangladeshBarbadosBelarusBelgiumBelizeBeninBermudaBhutanBoliviaBosnia and HerzegovinaBotswanaBrazilBritish Virgin IslandsBrunei DarussalamBulgariaBurkina FasoBurundiCabo VerdeCambodiaCameroonCanadaCaribbean small statesCayman IslandsCentral African RepublicCentral Europe and the BalticsChadChileChinaColombiaComorosCongo, Dem. Rep.Congo, Rep.Costa RicaCote d'IvoireCroatiaCubaCyprusCzech RepublicDenmarkDjiboutiDominicaDominican RepublicEarly-demographic dividendEast Asia & PacificEast Asia & Pacific (excluding high income)East Asia & Pacific (IDA & IBRD countries)EcuadorEgypt, Arab Rep.El SalvadorEquatorial GuineaEritreaEstoniaEthiopiaEuro areaEurope & Central AsiaEurope & Central Asia (excluding high income)Europe & Central Asia (IDA & IBRD countries)European UnionFaroe IslandsFijiFinlandFragile and conflict affected situationsFranceFrench PolynesiaGabonGambia, TheGeorgiaGermanyGhanaGibraltarGreeceGreenlandGrenadaGuamGuatemalaGuineaGuinea-BissauGuyanaHaitiHeavily indebted poor countries (HIPC)High incomeHondurasHong Kong SAR, ChinaHungaryIBRD onlyIcelandIDA & IBRD totalIDA blendIDA onlyIDA totalIndiaIndonesiaIran, Islamic Rep.IraqIrelandIsraelItalyJamaicaJapanJordanKazakhstanKenyaKiribatiKorea, Dem. People’s Rep.Korea, Rep.KuwaitKyrgyz RepublicLao PDRLate-demographic dividendLatin America & Caribbean Latin America & Caribbean (excluding high income)Latin America & the Caribbean (IDA & IBRD countries)LatviaLeast developed countries: UN classificationLebanonLesothoLiberiaLibyaLithuaniaLow & middle incomeLow incomeLower middle incomeLuxembourgMacao SAR, ChinaMacedonia, FYRMadagascarMalawiMalaysiaMaldivesMaliMaltaMarshall IslandsMauritaniaMauritiusMexicoMicronesia, Fed. Sts.Middle East & North AfricaMiddle East & North Africa (excluding high income)Middle East & North Africa (IDA & IBRD countries)Middle incomeMoldovaMongoliaMoroccoMozambiqueMyanmarNamibiaNauruNepalNetherlandsNew CaledoniaNew ZealandNicaraguaNigerNigeriaNorth AmericaNorthern Mariana IslandsNorwayOECD membersOmanOther small statesPacific island small statesPakistanPalauPanamaPapua New GuineaParaguayPeruPhilippinesPolandPortugalPost-demographic dividendPre-demographic dividendPuerto RicoQatarRomaniaRussian FederationRwandaSamoaSao Tome and PrincipeSaudi ArabiaSenegalSerbiaSeychellesSierra LeoneSingaporeSlovak RepublicSloveniaSmall statesSolomon IslandsSomaliaSouth AfricaSouth AsiaSouth Asia (IDA & IBRD)SpainSri LankaSt. Kitts and NevisSt. LuciaSt. Vincent and the GrenadinesSub-Saharan Africa Sub-Saharan Africa (excluding high income)Sub-Saharan Africa (IDA & IBRD countries)SudanSurinameSwazilandSwedenSwitzerlandSyrian Arab RepublicTajikistanTanzaniaThailandTimor-LesteTogoTongaTrinidad and TobagoTunisiaTurkeyTurkmenistanTurks and Caicos IslandsTuvaluUgandaUkraineUnited Arab EmiratesUnited KingdomUnited StatesUpper middle incomeUruguayUzbekistanVanuatuVenezuela, RBVietnamVirgin Islands (U.S.)WorldYemen, Rep.ZambiaZimbabwe Timeline:
This timeline shows a graph from 1971 to 2009 of Lesotho. No data until 1970. Number of actual observations by date: 39.
Source name:
World Development Indicators
Source organization:
World Bank staff estimates from original source: European Commission, Joint Research Centre (JRC)/Netherlands Environmental Assessment Agency (PBL). Emission Database for Global Atmospheric Research (EDGAR): http://edgar.jrc.ec.europa.eu/.
Categories, topics:
Energy & Mining, Environment
Last updated:
apr 23, 2017
Indicators value changes by year
Minimum:
18.095
jan 1, 1993
At the date of observation
Value
Absolute change
Change from previous value
jan 1, 1971
18.747
+18.747
0.0%
jan 1, 1972
20.418
+1.672
8.92%
jan 1, 1973
20.713
+0.295
1.45%
jan 1, 1974
20.065
-0.649
-3.13%
jan 1, 1975
19.672
-0.393
-1.96%
jan 1, 1976
20.08
+0.407
2.07%
jan 1, 1977
20.476
+0.397
1.98%
jan 1, 1978
21.688
+1.211
5.92%
jan 1, 1979
21.261
-0.426
-1.97%
jan 1, 1980
20.569
-0.693
-3.26%
jan 1, 1981
20.308
-0.261
-1.27%
jan 1, 1982
20.676
+0.368
1.81%
jan 1, 1983
20.262
-0.414
-2.0%
jan 1, 1984
21.594
+1.333
6.58%
jan 1, 1985
22.16
+0.566
2.62%
jan 1, 1986
21.785
-0.375
-1.69%
jan 1, 1987
22.051
+0.267
1.22%
jan 1, 1988
19.764
-2.287
-10.37%
jan 1, 1989
20.135
+0.371
1.88%
jan 1, 1990
20.845
+0.71
3.53%
jan 1, 1991
19.065
-1.78
-8.54%
jan 1, 1992
19.674
+0.608
3.19%
jan 1, 1993
18.095
-1.579
-8.02%
jan 1, 1994
19.495
+1.4
7.74%
jan 1, 1995
20.282
+0.787
4.04%
jan 1, 1996
20.978
+0.696
3.43%
jan 1, 1997
22.532
+1.554
7.41%
jan 1, 1998
23.312
+0.78
3.46%
jan 1, 1999
24.002
+0.69
2.96%
jan 1, 2000
24.451
+0.449
1.87%
jan 1, 2001
26.609
+2.158
8.83%
jan 1, 2002
27.577
+0.968
3.64%
jan 1, 2003
23.769
-3.808
-13.81%
jan 1, 2004
24.248
+0.479
2.02%
jan 1, 2005
29.44
+5.192
21.41%
jan 1, 2006
26.67
-2.77
-9.41%
jan 1, 2007
27.211
+0.542
2.03%
jan 1, 2008
27.069
-0.142
-0.52%
jan 1, 2009
27.072
+0.003
0.01%
Ranking of countries by current statistics by years


Comments: