29
/
en
AIzaSyAYiBZKx7MnpbEhh9jyipgxe19OcubqV5w
April 1, 2024
169243
Korea, Dem. People’s Rep.
PRK
true
2
1
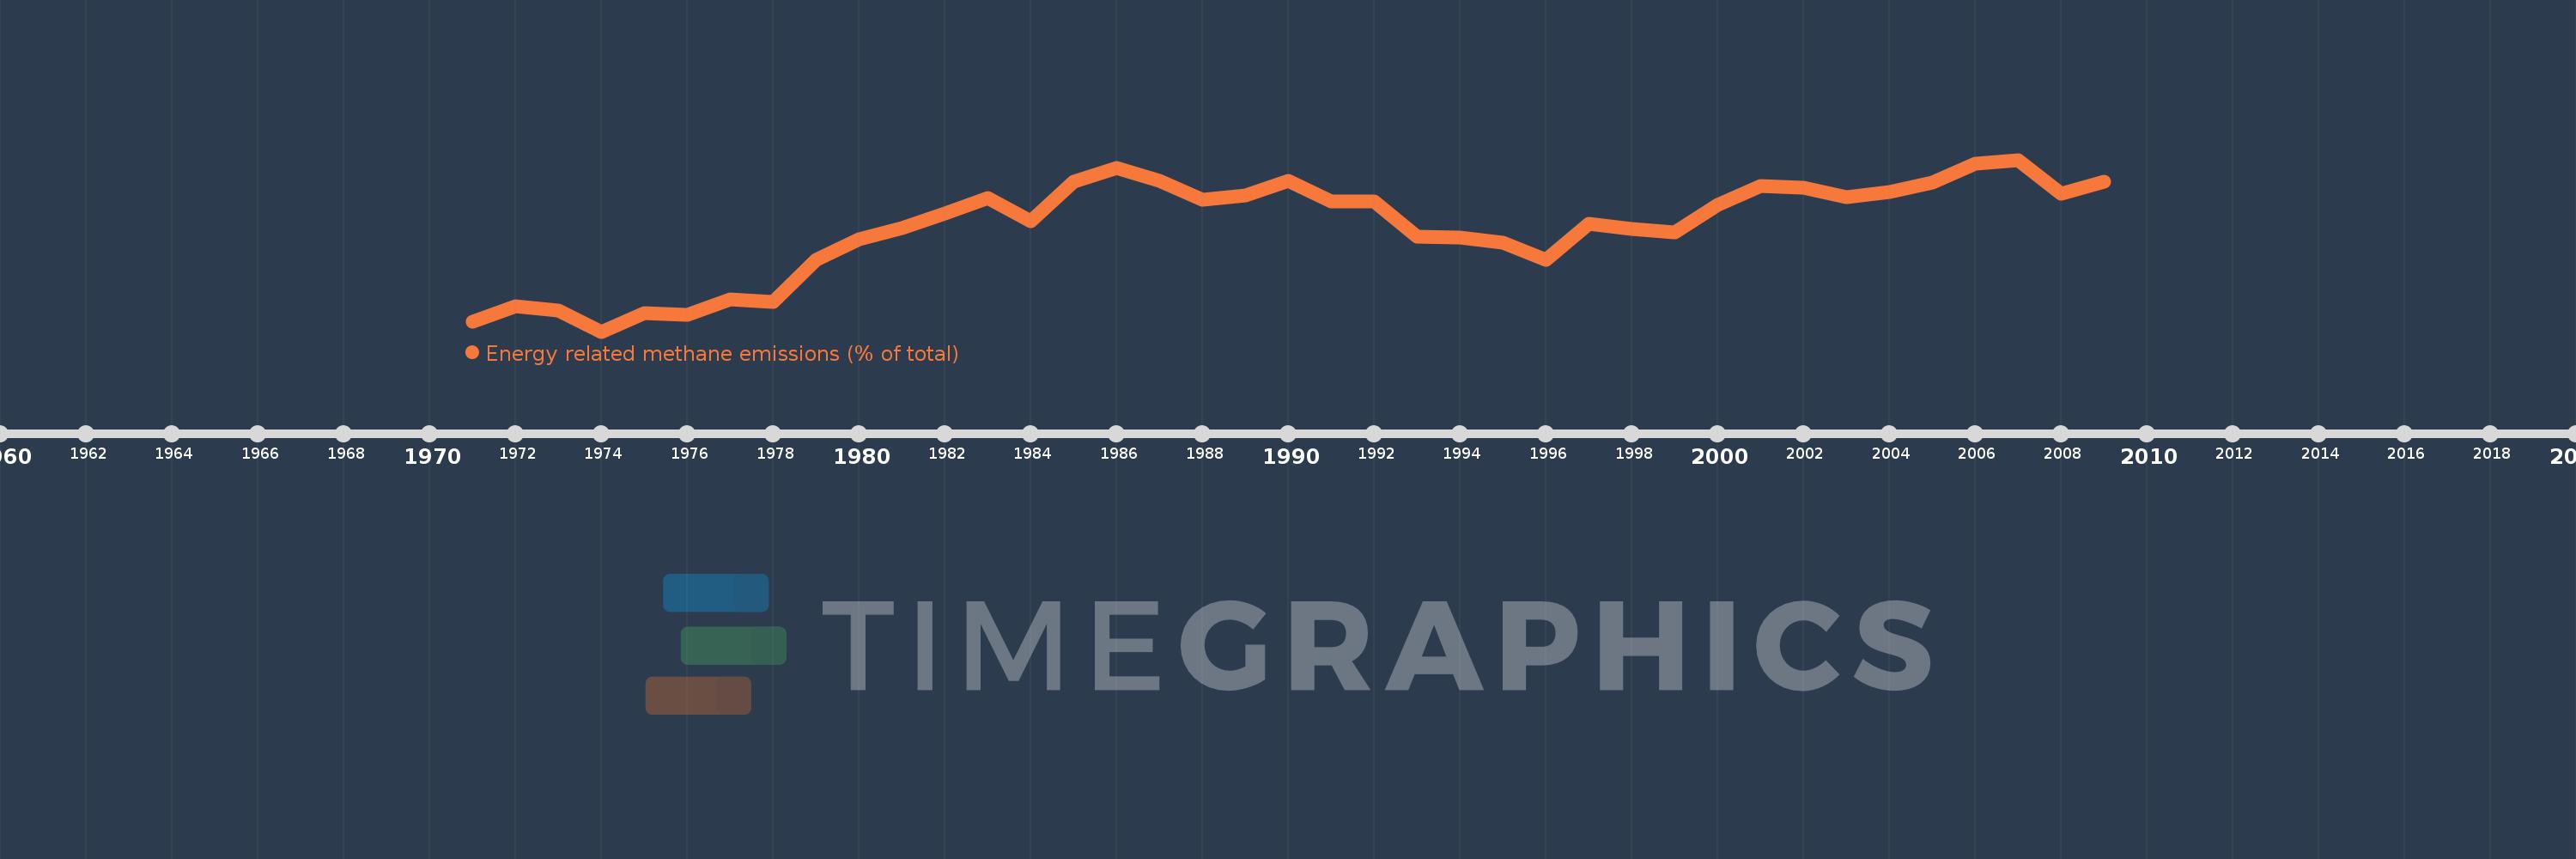
Energy related methane emissions (% of total)
2009,2008,2007,2006,2005,2004,2003,2002,2001,2000,1999,1998,1997,1996,1995,1994,1993,1992,1991,1990,1989,1988,1987,1986,1985,1984,1983,1982,1981,1980,1979,1978,1977,1976,1975,1974,1973,1972,1971
This statistics in other country:
AfghanistanAlbaniaAlgeriaAmerican SamoaAngolaAntigua and BarbudaArab WorldArgentinaArmeniaArubaAustraliaAustriaAzerbaijanBahamas, TheBahrainBangladeshBarbadosBelarusBelgiumBelizeBeninBermudaBhutanBoliviaBosnia and HerzegovinaBotswanaBrazilBritish Virgin IslandsBrunei DarussalamBulgariaBurkina FasoBurundiCabo VerdeCambodiaCameroonCanadaCaribbean small statesCayman IslandsCentral African RepublicCentral Europe and the BalticsChadChileChinaColombiaComorosCongo, Dem. Rep.Congo, Rep.Costa RicaCote d'IvoireCroatiaCubaCyprusCzech RepublicDenmarkDjiboutiDominicaDominican RepublicEarly-demographic dividendEast Asia & PacificEast Asia & Pacific (excluding high income)East Asia & Pacific (IDA & IBRD countries)EcuadorEgypt, Arab Rep.El SalvadorEquatorial GuineaEritreaEstoniaEthiopiaEuro areaEurope & Central AsiaEurope & Central Asia (excluding high income)Europe & Central Asia (IDA & IBRD countries)European UnionFaroe IslandsFijiFinlandFragile and conflict affected situationsFranceFrench PolynesiaGabonGambia, TheGeorgiaGermanyGhanaGibraltarGreeceGreenlandGrenadaGuamGuatemalaGuineaGuinea-BissauGuyanaHaitiHeavily indebted poor countries (HIPC)High incomeHondurasHong Kong SAR, ChinaHungaryIBRD onlyIcelandIDA & IBRD totalIDA blendIDA onlyIDA totalIndiaIndonesiaIran, Islamic Rep.IraqIrelandIsraelItalyJamaicaJapanJordanKazakhstanKenyaKiribatiKorea, Dem. People’s Rep.Korea, Rep.KuwaitKyrgyz RepublicLao PDRLate-demographic dividendLatin America & Caribbean Latin America & Caribbean (excluding high income)Latin America & the Caribbean (IDA & IBRD countries)LatviaLeast developed countries: UN classificationLebanonLesothoLiberiaLibyaLithuaniaLow & middle incomeLow incomeLower middle incomeLuxembourgMacao SAR, ChinaMacedonia, FYRMadagascarMalawiMalaysiaMaldivesMaliMaltaMarshall IslandsMauritaniaMauritiusMexicoMicronesia, Fed. Sts.Middle East & North AfricaMiddle East & North Africa (excluding high income)Middle East & North Africa (IDA & IBRD countries)Middle incomeMoldovaMongoliaMoroccoMozambiqueMyanmarNamibiaNauruNepalNetherlandsNew CaledoniaNew ZealandNicaraguaNigerNigeriaNorth AmericaNorthern Mariana IslandsNorwayOECD membersOmanOther small statesPacific island small statesPakistanPalauPanamaPapua New GuineaParaguayPeruPhilippinesPolandPortugalPost-demographic dividendPre-demographic dividendPuerto RicoQatarRomaniaRussian FederationRwandaSamoaSao Tome and PrincipeSaudi ArabiaSenegalSerbiaSeychellesSierra LeoneSingaporeSlovak RepublicSloveniaSmall statesSolomon IslandsSomaliaSouth AfricaSouth AsiaSouth Asia (IDA & IBRD)SpainSri LankaSt. Kitts and NevisSt. LuciaSt. Vincent and the GrenadinesSub-Saharan Africa Sub-Saharan Africa (excluding high income)Sub-Saharan Africa (IDA & IBRD countries)SudanSurinameSwazilandSwedenSwitzerlandSyrian Arab RepublicTajikistanTanzaniaThailandTimor-LesteTogoTongaTrinidad and TobagoTunisiaTurkeyTurkmenistanTurks and Caicos IslandsTuvaluUgandaUkraineUnited Arab EmiratesUnited KingdomUnited StatesUpper middle incomeUruguayUzbekistanVanuatuVenezuela, RBVietnamVirgin Islands (U.S.)WorldYemen, Rep.ZambiaZimbabwe Timeline:
This timeline shows a graph from 1971 to 2009 of Korea, Dem. People’s Rep.. No data until 1970. Number of actual observations by date: 39.
Source name:
World Development Indicators
Source organization:
World Bank staff estimates from original source: European Commission, Joint Research Centre (JRC)/Netherlands Environmental Assessment Agency (PBL). Emission Database for Global Atmospheric Research (EDGAR): http://edgar.jrc.ec.europa.eu/.
Categories, topics:
Energy & Mining, Environment
Last updated:
apr 23, 2017
Indicators value changes by year
Minimum:
44.005
jan 1, 1974
Maximum:
61.344
jan 1, 2007
At the date of observation
Value
Absolute change
Change from previous value
jan 1, 1971
45.035
+45.035
0.0%
jan 1, 1972
46.557
+1.522
3.38%
jan 1, 1973
46.136
-0.421
-0.9%
jan 1, 1974
44.005
-2.131
-4.62%
jan 1, 1975
45.868
+1.863
4.23%
jan 1, 1976
45.663
-0.205
-0.45%
jan 1, 1977
47.291
+1.628
3.56%
jan 1, 1978
47.023
-0.267
-0.57%
jan 1, 1979
51.227
+4.204
8.94%
jan 1, 1980
53.358
+2.131
4.16%
jan 1, 1981
54.426
+1.068
2.0%
jan 1, 1982
55.948
+1.522
2.8%
jan 1, 1983
57.514
+1.566
2.8%
jan 1, 1984
55.165
-2.349
-4.08%
jan 1, 1985
59.111
+3.945
7.15%
jan 1, 1986
60.544
+1.433
2.42%
jan 1, 1987
59.26
-1.284
-2.12%
jan 1, 1988
57.355
-1.905
-3.21%
jan 1, 1989
57.766
+0.411
0.72%
jan 1, 1990
59.188
+1.422
2.46%
jan 1, 1991
57.133
-2.055
-3.47%
jan 1, 1992
57.12
-0.013
-0.02%
jan 1, 1993
53.575
-3.545
-6.21%
jan 1, 1994
53.536
-0.039
-0.07%
jan 1, 1995
52.935
-0.601
-1.12%
jan 1, 1996
51.228
-1.707
-3.22%
jan 1, 1997
54.862
+3.633
7.09%
jan 1, 1998
54.357
-0.505
-0.92%
jan 1, 1999
54.023
-0.334
-0.61%
jan 1, 2000
56.753
+2.73
5.05%
jan 1, 2001
58.721
+1.968
3.47%
jan 1, 2002
58.515
-0.207
-0.35%
jan 1, 2003
57.552
-0.962
-1.64%
jan 1, 2004
58.107
+0.555
0.96%
jan 1, 2005
59.086
+0.979
1.68%
jan 1, 2006
60.942
+1.856
3.14%
jan 1, 2007
61.344
+0.402
0.66%
jan 1, 2008
57.89
-3.454
-5.63%
jan 1, 2009
59.149
+1.259
2.17%
Ranking of countries by current statistics by years


Comments: