29
/
en
AIzaSyAYiBZKx7MnpbEhh9jyipgxe19OcubqV5w
April 1, 2024
214239
Norway
NOR
true
2
1
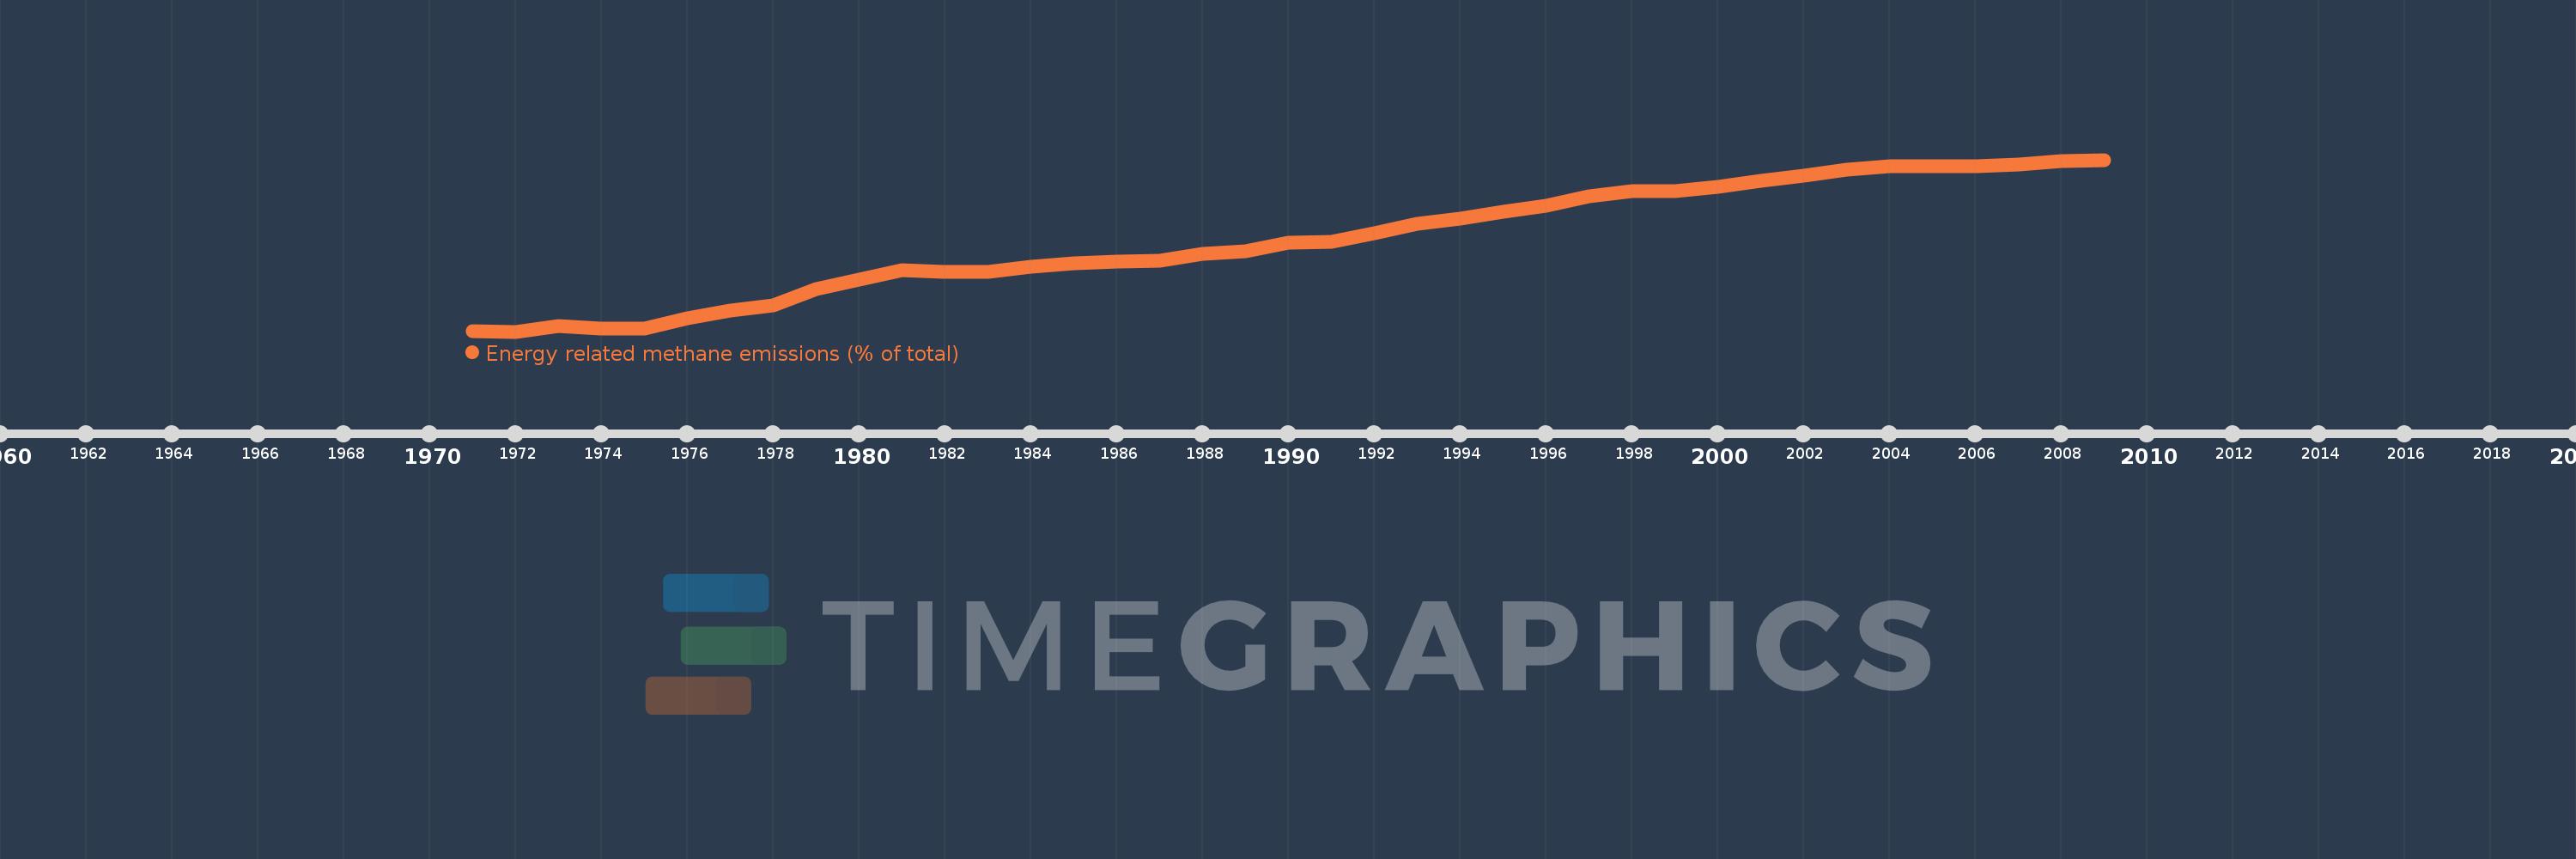
Energy related methane emissions (% of total)
2009,2008,2007,2006,2005,2004,2003,2002,2001,2000,1999,1998,1997,1996,1995,1994,1993,1992,1991,1990,1989,1988,1987,1986,1985,1984,1983,1982,1981,1980,1979,1978,1977,1976,1975,1974,1973,1972,1971
This statistics in other country:
AfghanistanAlbaniaAlgeriaAmerican SamoaAngolaAntigua and BarbudaArab WorldArgentinaArmeniaArubaAustraliaAustriaAzerbaijanBahamas, TheBahrainBangladeshBarbadosBelarusBelgiumBelizeBeninBermudaBhutanBoliviaBosnia and HerzegovinaBotswanaBrazilBritish Virgin IslandsBrunei DarussalamBulgariaBurkina FasoBurundiCabo VerdeCambodiaCameroonCanadaCaribbean small statesCayman IslandsCentral African RepublicCentral Europe and the BalticsChadChileChinaColombiaComorosCongo, Dem. Rep.Congo, Rep.Costa RicaCote d'IvoireCroatiaCubaCyprusCzech RepublicDenmarkDjiboutiDominicaDominican RepublicEarly-demographic dividendEast Asia & PacificEast Asia & Pacific (excluding high income)East Asia & Pacific (IDA & IBRD countries)EcuadorEgypt, Arab Rep.El SalvadorEquatorial GuineaEritreaEstoniaEthiopiaEuro areaEurope & Central AsiaEurope & Central Asia (excluding high income)Europe & Central Asia (IDA & IBRD countries)European UnionFaroe IslandsFijiFinlandFragile and conflict affected situationsFranceFrench PolynesiaGabonGambia, TheGeorgiaGermanyGhanaGibraltarGreeceGreenlandGrenadaGuamGuatemalaGuineaGuinea-BissauGuyanaHaitiHeavily indebted poor countries (HIPC)High incomeHondurasHong Kong SAR, ChinaHungaryIBRD onlyIcelandIDA & IBRD totalIDA blendIDA onlyIDA totalIndiaIndonesiaIran, Islamic Rep.IraqIrelandIsraelItalyJamaicaJapanJordanKazakhstanKenyaKiribatiKorea, Dem. People’s Rep.Korea, Rep.KuwaitKyrgyz RepublicLao PDRLate-demographic dividendLatin America & Caribbean Latin America & Caribbean (excluding high income)Latin America & the Caribbean (IDA & IBRD countries)LatviaLeast developed countries: UN classificationLebanonLesothoLiberiaLibyaLithuaniaLow & middle incomeLow incomeLower middle incomeLuxembourgMacao SAR, ChinaMacedonia, FYRMadagascarMalawiMalaysiaMaldivesMaliMaltaMarshall IslandsMauritaniaMauritiusMexicoMicronesia, Fed. Sts.Middle East & North AfricaMiddle East & North Africa (excluding high income)Middle East & North Africa (IDA & IBRD countries)Middle incomeMoldovaMongoliaMoroccoMozambiqueMyanmarNamibiaNauruNepalNetherlandsNew CaledoniaNew ZealandNicaraguaNigerNigeriaNorth AmericaNorthern Mariana IslandsNorwayOECD membersOmanOther small statesPacific island small statesPakistanPalauPanamaPapua New GuineaParaguayPeruPhilippinesPolandPortugalPost-demographic dividendPre-demographic dividendPuerto RicoQatarRomaniaRussian FederationRwandaSamoaSao Tome and PrincipeSaudi ArabiaSenegalSerbiaSeychellesSierra LeoneSingaporeSlovak RepublicSloveniaSmall statesSolomon IslandsSomaliaSouth AfricaSouth AsiaSouth Asia (IDA & IBRD)SpainSri LankaSt. Kitts and NevisSt. LuciaSt. Vincent and the GrenadinesSub-Saharan Africa Sub-Saharan Africa (excluding high income)Sub-Saharan Africa (IDA & IBRD countries)SudanSurinameSwazilandSwedenSwitzerlandSyrian Arab RepublicTajikistanTanzaniaThailandTimor-LesteTogoTongaTrinidad and TobagoTunisiaTurkeyTurkmenistanTurks and Caicos IslandsTuvaluUgandaUkraineUnited Arab EmiratesUnited KingdomUnited StatesUpper middle incomeUruguayUzbekistanVanuatuVenezuela, RBVietnamVirgin Islands (U.S.)WorldYemen, Rep.ZambiaZimbabwe Timeline:
This timeline shows a graph from 1971 to 2009 of Norway. No data until 1970. Number of actual observations by date: 39.
Source name:
World Development Indicators
Source organization:
World Bank staff estimates from original source: European Commission, Joint Research Centre (JRC)/Netherlands Environmental Assessment Agency (PBL). Emission Database for Global Atmospheric Research (EDGAR): http://edgar.jrc.ec.europa.eu/.
Categories, topics:
Energy & Mining, Environment
Last updated:
apr 23, 2017
Indicators value changes by year
Maximum:
76.301
jan 1, 2009
At the date of observation
Value
Absolute change
Change from previous value
jan 1, 1971
7.283
+7.283
0.0%
jan 1, 1972
7.174
-0.109
-1.49%
jan 1, 1973
9.33
+2.156
30.05%
jan 1, 1974
8.319
-1.011
-10.84%
jan 1, 1975
8.523
+0.204
2.45%
jan 1, 1976
12.575
+4.053
47.55%
jan 1, 1977
15.759
+3.184
25.32%
jan 1, 1978
17.69
+1.931
12.25%
jan 1, 1979
24.242
+6.552
37.04%
jan 1, 1980
28.104
+3.862
15.93%
jan 1, 1981
31.998
+3.894
13.86%
jan 1, 1982
31.366
-0.632
-1.98%
jan 1, 1983
31.245
-0.12
-0.38%
jan 1, 1984
33.4
+2.155
6.9%
jan 1, 1985
34.508
+1.108
3.32%
jan 1, 1986
35.209
+0.701
2.03%
jan 1, 1987
35.694
+0.485
1.38%
jan 1, 1988
38.5
+2.806
7.86%
jan 1, 1989
39.505
+1.005
2.61%
jan 1, 1990
42.813
+3.309
8.38%
jan 1, 1991
43.421
+0.608
1.42%
jan 1, 1992
46.812
+3.391
7.81%
jan 1, 1993
50.569
+3.756
8.02%
jan 1, 1994
52.55
+1.981
3.92%
jan 1, 1995
55.432
+2.883
5.49%
jan 1, 1996
57.682
+2.25
4.06%
jan 1, 1997
61.773
+4.091
7.09%
jan 1, 1998
63.652
+1.88
3.04%
jan 1, 1999
63.752
+0.1
0.16%
jan 1, 2000
65.446
+1.694
2.66%
jan 1, 2001
67.754
+2.308
3.53%
jan 1, 2002
69.869
+2.116
3.12%
jan 1, 2003
72.186
+2.317
3.32%
jan 1, 2004
73.629
+1.444
2.0%
jan 1, 2005
73.807
+0.178
0.24%
jan 1, 2006
73.816
+0.008
0.01%
jan 1, 2007
74.454
+0.639
0.87%
jan 1, 2008
75.657
+1.203
1.62%
jan 1, 2009
76.301
+0.644
0.85%
Ranking of countries by current statistics by years


Comments: