29
/
en
AIzaSyAYiBZKx7MnpbEhh9jyipgxe19OcubqV5w
April 1, 2024
224768
Poland
POL
true
2
1
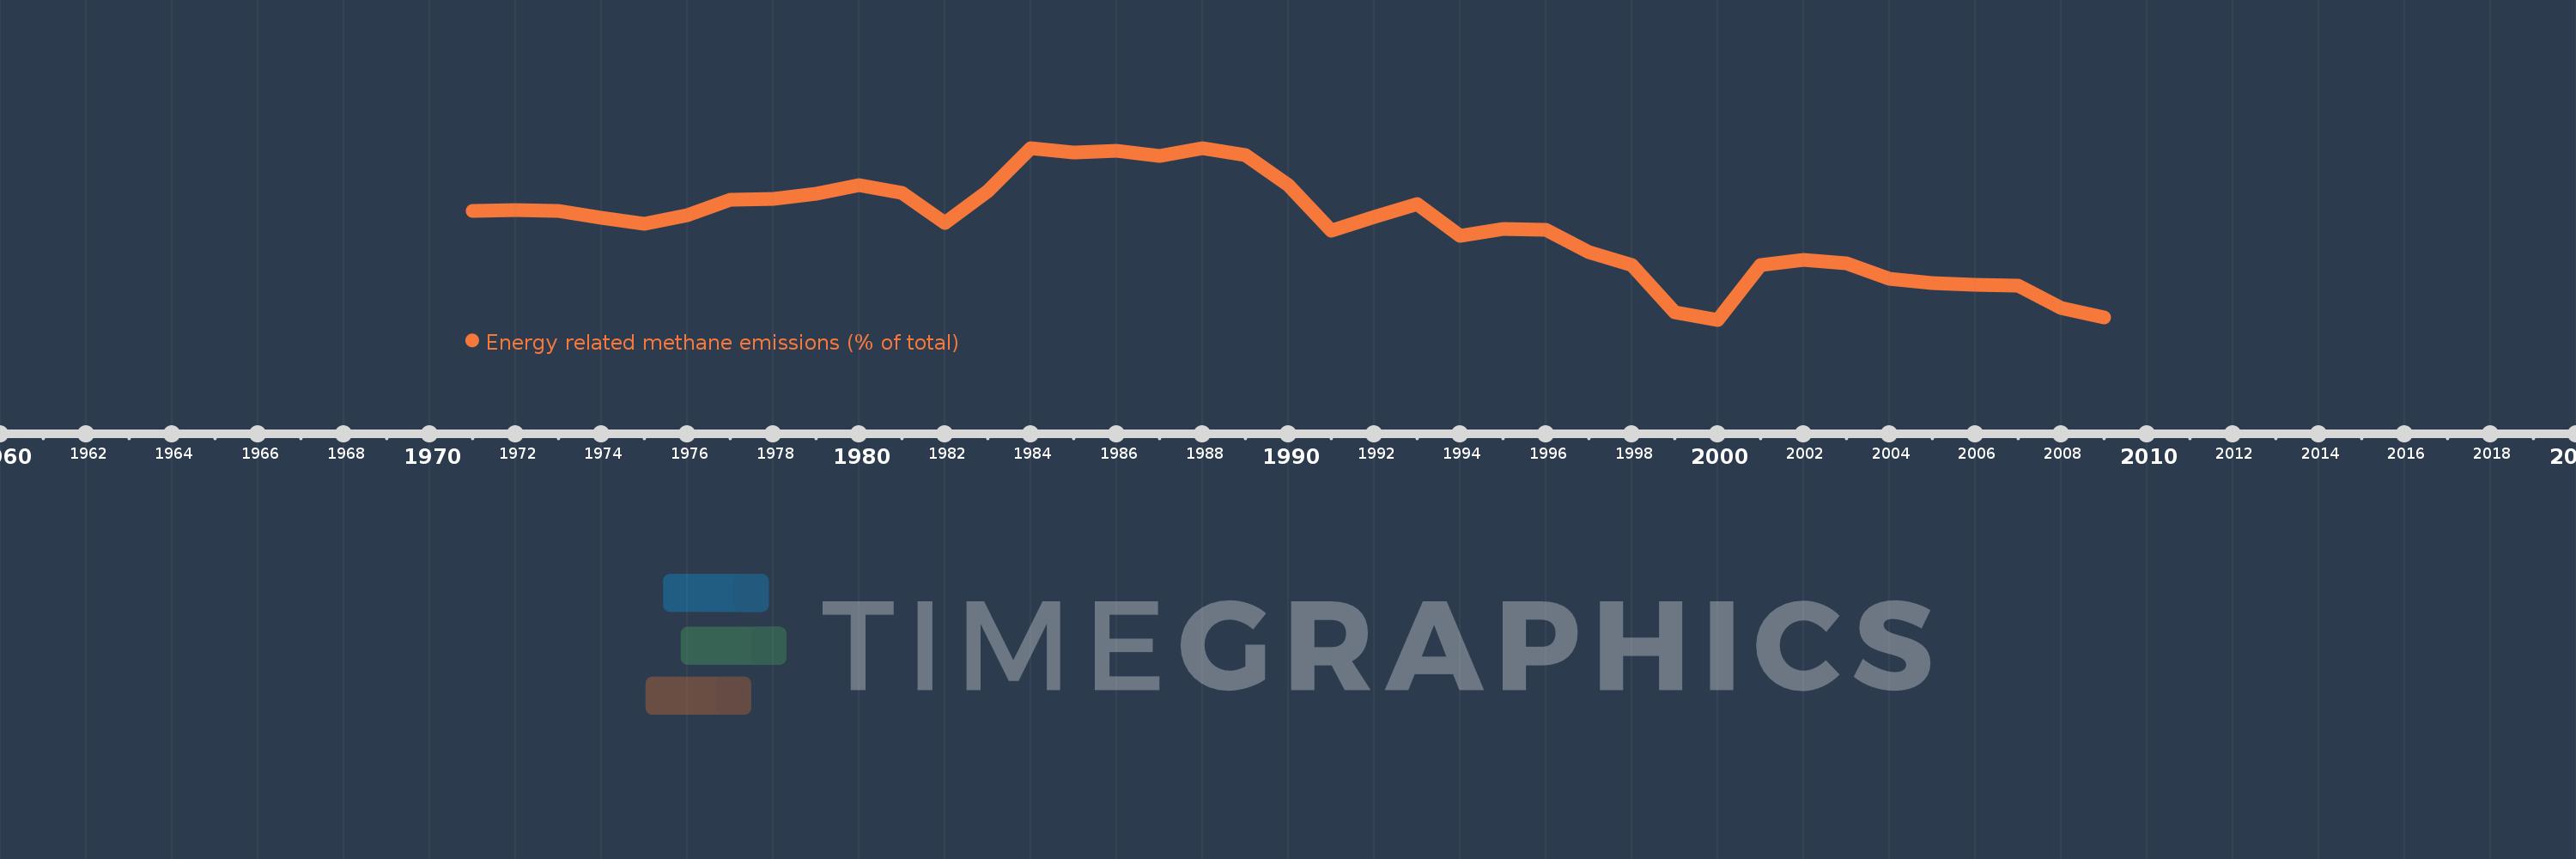
Energy related methane emissions (% of total)
2009,2008,2007,2006,2005,2004,2003,2002,2001,2000,1999,1998,1997,1996,1995,1994,1993,1992,1991,1990,1989,1988,1987,1986,1985,1984,1983,1982,1981,1980,1979,1978,1977,1976,1975,1974,1973,1972,1971
This statistics in other country:
AfghanistanAlbaniaAlgeriaAmerican SamoaAngolaAntigua and BarbudaArab WorldArgentinaArmeniaArubaAustraliaAustriaAzerbaijanBahamas, TheBahrainBangladeshBarbadosBelarusBelgiumBelizeBeninBermudaBhutanBoliviaBosnia and HerzegovinaBotswanaBrazilBritish Virgin IslandsBrunei DarussalamBulgariaBurkina FasoBurundiCabo VerdeCambodiaCameroonCanadaCaribbean small statesCayman IslandsCentral African RepublicCentral Europe and the BalticsChadChileChinaColombiaComorosCongo, Dem. Rep.Congo, Rep.Costa RicaCote d'IvoireCroatiaCubaCyprusCzech RepublicDenmarkDjiboutiDominicaDominican RepublicEarly-demographic dividendEast Asia & PacificEast Asia & Pacific (excluding high income)East Asia & Pacific (IDA & IBRD countries)EcuadorEgypt, Arab Rep.El SalvadorEquatorial GuineaEritreaEstoniaEthiopiaEuro areaEurope & Central AsiaEurope & Central Asia (excluding high income)Europe & Central Asia (IDA & IBRD countries)European UnionFaroe IslandsFijiFinlandFragile and conflict affected situationsFranceFrench PolynesiaGabonGambia, TheGeorgiaGermanyGhanaGibraltarGreeceGreenlandGrenadaGuamGuatemalaGuineaGuinea-BissauGuyanaHaitiHeavily indebted poor countries (HIPC)High incomeHondurasHong Kong SAR, ChinaHungaryIBRD onlyIcelandIDA & IBRD totalIDA blendIDA onlyIDA totalIndiaIndonesiaIran, Islamic Rep.IraqIrelandIsraelItalyJamaicaJapanJordanKazakhstanKenyaKiribatiKorea, Dem. People’s Rep.Korea, Rep.KuwaitKyrgyz RepublicLao PDRLate-demographic dividendLatin America & Caribbean Latin America & Caribbean (excluding high income)Latin America & the Caribbean (IDA & IBRD countries)LatviaLeast developed countries: UN classificationLebanonLesothoLiberiaLibyaLithuaniaLow & middle incomeLow incomeLower middle incomeLuxembourgMacao SAR, ChinaMacedonia, FYRMadagascarMalawiMalaysiaMaldivesMaliMaltaMarshall IslandsMauritaniaMauritiusMexicoMicronesia, Fed. Sts.Middle East & North AfricaMiddle East & North Africa (excluding high income)Middle East & North Africa (IDA & IBRD countries)Middle incomeMoldovaMongoliaMoroccoMozambiqueMyanmarNamibiaNauruNepalNetherlandsNew CaledoniaNew ZealandNicaraguaNigerNigeriaNorth AmericaNorthern Mariana IslandsNorwayOECD membersOmanOther small statesPacific island small statesPakistanPalauPanamaPapua New GuineaParaguayPeruPhilippinesPolandPortugalPost-demographic dividendPre-demographic dividendPuerto RicoQatarRomaniaRussian FederationRwandaSamoaSao Tome and PrincipeSaudi ArabiaSenegalSerbiaSeychellesSierra LeoneSingaporeSlovak RepublicSloveniaSmall statesSolomon IslandsSomaliaSouth AfricaSouth AsiaSouth Asia (IDA & IBRD)SpainSri LankaSt. Kitts and NevisSt. LuciaSt. Vincent and the GrenadinesSub-Saharan Africa Sub-Saharan Africa (excluding high income)Sub-Saharan Africa (IDA & IBRD countries)SudanSurinameSwazilandSwedenSwitzerlandSyrian Arab RepublicTajikistanTanzaniaThailandTimor-LesteTogoTongaTrinidad and TobagoTunisiaTurkeyTurkmenistanTurks and Caicos IslandsTuvaluUgandaUkraineUnited Arab EmiratesUnited KingdomUnited StatesUpper middle incomeUruguayUzbekistanVanuatuVenezuela, RBVietnamVirgin Islands (U.S.)WorldYemen, Rep.ZambiaZimbabwe Timeline:
This timeline shows a graph from 1971 to 2009 of Poland. No data until 1970. Number of actual observations by date: 39.
Source name:
World Development Indicators
Source organization:
World Bank staff estimates from original source: European Commission, Joint Research Centre (JRC)/Netherlands Environmental Assessment Agency (PBL). Emission Database for Global Atmospheric Research (EDGAR): http://edgar.jrc.ec.europa.eu/.
Categories, topics:
Energy & Mining, Environment
Last updated:
apr 23, 2017
Indicators value changes by year
Minimum:
62.781
jan 1, 2000
Maximum:
75.772
jan 1, 1984
At the date of observation
Value
Absolute change
Change from previous value
jan 1, 1971
71.001
+71.001
0.0%
jan 1, 1972
71.048
+0.047
0.07%
jan 1, 1973
70.979
-0.069
-0.1%
jan 1, 1974
70.517
-0.462
-0.65%
jan 1, 1975
70.053
-0.464
-0.66%
jan 1, 1976
70.657
+0.604
0.86%
jan 1, 1977
71.829
+1.173
1.66%
jan 1, 1978
71.946
+0.117
0.16%
jan 1, 1979
72.286
+0.34
0.47%
jan 1, 1980
72.984
+0.698
0.97%
jan 1, 1981
72.361
-0.623
-0.85%
jan 1, 1982
70.069
-2.292
-3.17%
jan 1, 1983
72.536
+2.466
3.52%
jan 1, 1984
75.772
+3.237
4.46%
jan 1, 1985
75.399
-0.373
-0.49%
jan 1, 1986
75.557
+0.158
0.21%
jan 1, 1987
75.142
-0.415
-0.55%
jan 1, 1988
75.73
+0.589
0.78%
jan 1, 1989
75.258
-0.473
-0.62%
jan 1, 1990
72.981
-2.276
-3.02%
jan 1, 1991
69.492
-3.49
-4.78%
jan 1, 1992
70.533
+1.041
1.5%
jan 1, 1993
71.499
+0.966
1.37%
jan 1, 1994
69.14
-2.359
-3.3%
jan 1, 1995
69.652
+0.512
0.74%
jan 1, 1996
69.605
-0.047
-0.07%
jan 1, 1997
67.886
-1.719
-2.47%
jan 1, 1998
66.938
-0.948
-1.4%
jan 1, 1999
63.367
-3.571
-5.33%
jan 1, 2000
62.781
-0.587
-0.93%
jan 1, 2001
66.915
+4.134
6.58%
jan 1, 2002
67.286
+0.372
0.56%
jan 1, 2003
67.025
-0.261
-0.39%
jan 1, 2004
65.879
-1.146
-1.71%
jan 1, 2005
65.549
-0.33
-0.5%
jan 1, 2006
65.407
-0.142
-0.22%
jan 1, 2007
65.361
-0.046
-0.07%
jan 1, 2008
63.681
-1.68
-2.57%
jan 1, 2009
62.96
-0.721
-1.13%
Ranking of countries by current statistics by years


Comments: