29
/
en
AIzaSyAYiBZKx7MnpbEhh9jyipgxe19OcubqV5w
April 1, 2024
112157
Costa Rica
CRI
true
2
1
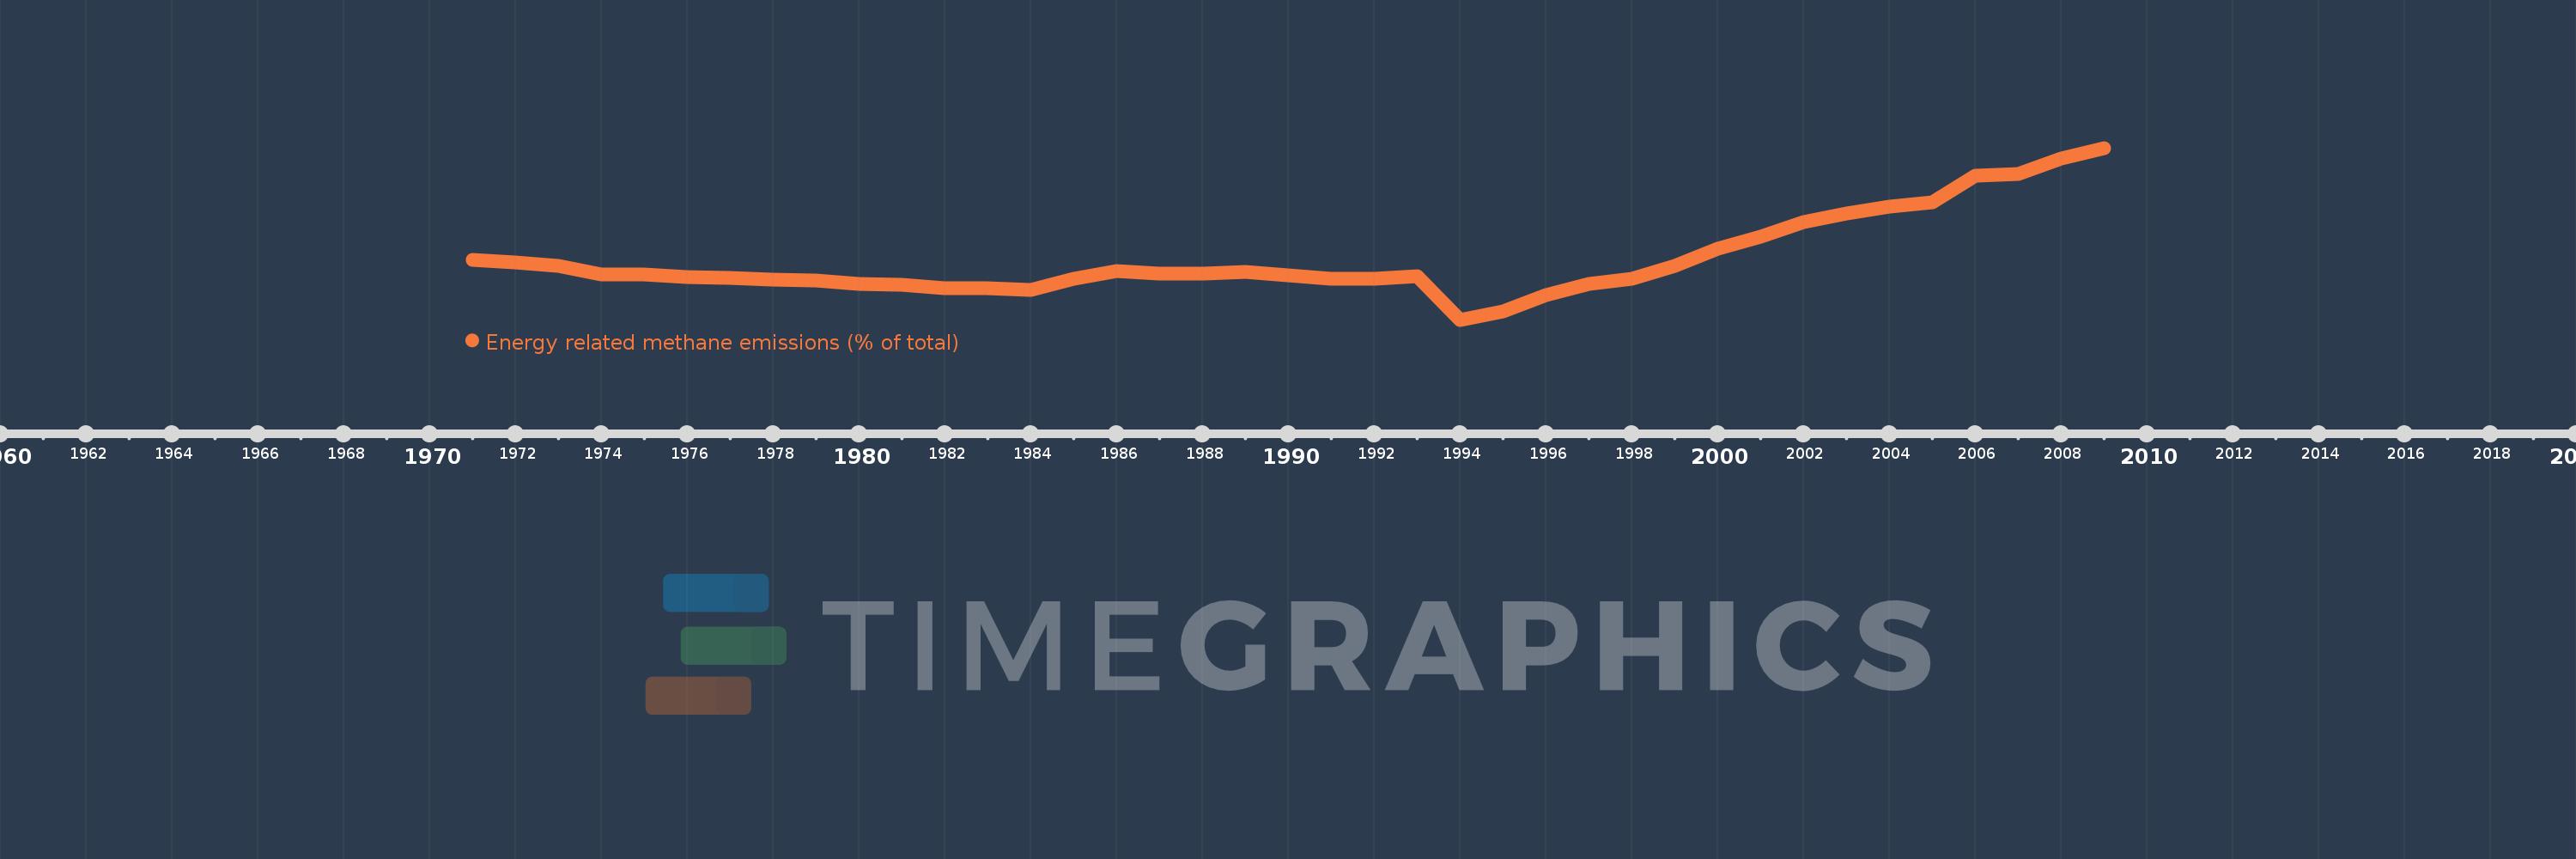
Energy related methane emissions (% of total)
2009,2008,2007,2006,2005,2004,2003,2002,2001,2000,1999,1998,1997,1996,1995,1994,1993,1992,1991,1990,1989,1988,1987,1986,1985,1984,1983,1982,1981,1980,1979,1978,1977,1976,1975,1974,1973,1972,1971
This statistics in other country:
AfghanistanAlbaniaAlgeriaAmerican SamoaAngolaAntigua and BarbudaArab WorldArgentinaArmeniaArubaAustraliaAustriaAzerbaijanBahamas, TheBahrainBangladeshBarbadosBelarusBelgiumBelizeBeninBermudaBhutanBoliviaBosnia and HerzegovinaBotswanaBrazilBritish Virgin IslandsBrunei DarussalamBulgariaBurkina FasoBurundiCabo VerdeCambodiaCameroonCanadaCaribbean small statesCayman IslandsCentral African RepublicCentral Europe and the BalticsChadChileChinaColombiaComorosCongo, Dem. Rep.Congo, Rep.Costa RicaCote d'IvoireCroatiaCubaCyprusCzech RepublicDenmarkDjiboutiDominicaDominican RepublicEarly-demographic dividendEast Asia & PacificEast Asia & Pacific (excluding high income)East Asia & Pacific (IDA & IBRD countries)EcuadorEgypt, Arab Rep.El SalvadorEquatorial GuineaEritreaEstoniaEthiopiaEuro areaEurope & Central AsiaEurope & Central Asia (excluding high income)Europe & Central Asia (IDA & IBRD countries)European UnionFaroe IslandsFijiFinlandFragile and conflict affected situationsFranceFrench PolynesiaGabonGambia, TheGeorgiaGermanyGhanaGibraltarGreeceGreenlandGrenadaGuamGuatemalaGuineaGuinea-BissauGuyanaHaitiHeavily indebted poor countries (HIPC)High incomeHondurasHong Kong SAR, ChinaHungaryIBRD onlyIcelandIDA & IBRD totalIDA blendIDA onlyIDA totalIndiaIndonesiaIran, Islamic Rep.IraqIrelandIsraelItalyJamaicaJapanJordanKazakhstanKenyaKiribatiKorea, Dem. People’s Rep.Korea, Rep.KuwaitKyrgyz RepublicLao PDRLate-demographic dividendLatin America & Caribbean Latin America & Caribbean (excluding high income)Latin America & the Caribbean (IDA & IBRD countries)LatviaLeast developed countries: UN classificationLebanonLesothoLiberiaLibyaLithuaniaLow & middle incomeLow incomeLower middle incomeLuxembourgMacao SAR, ChinaMacedonia, FYRMadagascarMalawiMalaysiaMaldivesMaliMaltaMarshall IslandsMauritaniaMauritiusMexicoMicronesia, Fed. Sts.Middle East & North AfricaMiddle East & North Africa (excluding high income)Middle East & North Africa (IDA & IBRD countries)Middle incomeMoldovaMongoliaMoroccoMozambiqueMyanmarNamibiaNauruNepalNetherlandsNew CaledoniaNew ZealandNicaraguaNigerNigeriaNorth AmericaNorthern Mariana IslandsNorwayOECD membersOmanOther small statesPacific island small statesPakistanPalauPanamaPapua New GuineaParaguayPeruPhilippinesPolandPortugalPost-demographic dividendPre-demographic dividendPuerto RicoQatarRomaniaRussian FederationRwandaSamoaSao Tome and PrincipeSaudi ArabiaSenegalSerbiaSeychellesSierra LeoneSingaporeSlovak RepublicSloveniaSmall statesSolomon IslandsSomaliaSouth AfricaSouth AsiaSouth Asia (IDA & IBRD)SpainSri LankaSt. Kitts and NevisSt. LuciaSt. Vincent and the GrenadinesSub-Saharan Africa Sub-Saharan Africa (excluding high income)Sub-Saharan Africa (IDA & IBRD countries)SudanSurinameSwazilandSwedenSwitzerlandSyrian Arab RepublicTajikistanTanzaniaThailandTimor-LesteTogoTongaTrinidad and TobagoTunisiaTurkeyTurkmenistanTurks and Caicos IslandsTuvaluUgandaUkraineUnited Arab EmiratesUnited KingdomUnited StatesUpper middle incomeUruguayUzbekistanVanuatuVenezuela, RBVietnamVirgin Islands (U.S.)WorldYemen, Rep.ZambiaZimbabwe Timeline:
This timeline shows a graph from 1971 to 2009 of Costa Rica. No data until 1970. Number of actual observations by date: 39.
Source name:
World Development Indicators
Source organization:
World Bank staff estimates from original source: European Commission, Joint Research Centre (JRC)/Netherlands Environmental Assessment Agency (PBL). Emission Database for Global Atmospheric Research (EDGAR): http://edgar.jrc.ec.europa.eu/.
Categories, topics:
Energy & Mining, Environment
Last updated:
apr 23, 2017
Indicators value changes by year
Maximum:
12.073
jan 1, 2009
At the date of observation
Value
Absolute change
Change from previous value
jan 1, 1971
5.555
+5.555
0.0%
jan 1, 1972
5.389
-0.166
-2.99%
jan 1, 1973
5.202
-0.187
-3.48%
jan 1, 1974
4.736
-0.466
-8.95%
jan 1, 1975
4.722
-0.014
-0.3%
jan 1, 1976
4.56
-0.162
-3.43%
jan 1, 1977
4.514
-0.046
-1.0%
jan 1, 1978
4.42
-0.094
-2.08%
jan 1, 1979
4.35
-0.071
-1.6%
jan 1, 1980
4.153
-0.197
-4.53%
jan 1, 1981
4.115
-0.038
-0.9%
jan 1, 1982
3.901
-0.214
-5.19%
jan 1, 1983
3.899
-0.002
-0.05%
jan 1, 1984
3.795
-0.105
-2.68%
jan 1, 1985
4.479
+0.685
18.04%
jan 1, 1986
4.899
+0.42
9.38%
jan 1, 1987
4.774
-0.126
-2.57%
jan 1, 1988
4.783
+0.009
0.2%
jan 1, 1989
4.845
+0.062
1.3%
jan 1, 1990
4.648
-0.197
-4.06%
jan 1, 1991
4.465
-0.183
-3.95%
jan 1, 1992
4.471
+0.007
0.15%
jan 1, 1993
4.624
+0.153
3.42%
jan 1, 1994
2.081
-2.543
-55.0%
jan 1, 1995
2.568
+0.487
23.41%
jan 1, 1996
3.528
+0.96
37.38%
jan 1, 1997
4.187
+0.659
18.69%
jan 1, 1998
4.456
+0.269
6.43%
jan 1, 1999
5.211
+0.754
16.93%
jan 1, 2000
6.213
+1.002
19.23%
jan 1, 2001
6.935
+0.722
11.63%
jan 1, 2002
7.786
+0.851
12.27%
jan 1, 2003
8.27
+0.483
6.21%
jan 1, 2004
8.67
+0.4
4.84%
jan 1, 2005
8.889
+0.219
2.53%
jan 1, 2006
10.469
+1.58
17.77%
jan 1, 2007
10.538
+0.069
0.66%
jan 1, 2008
11.442
+0.905
8.59%
jan 1, 2009
12.073
+0.631
5.51%
Ranking of countries by current statistics by years


Comments: