29
/
en
AIzaSyAYiBZKx7MnpbEhh9jyipgxe19OcubqV5w
April 1, 2024
126086
El Salvador
SLV
true
2
1
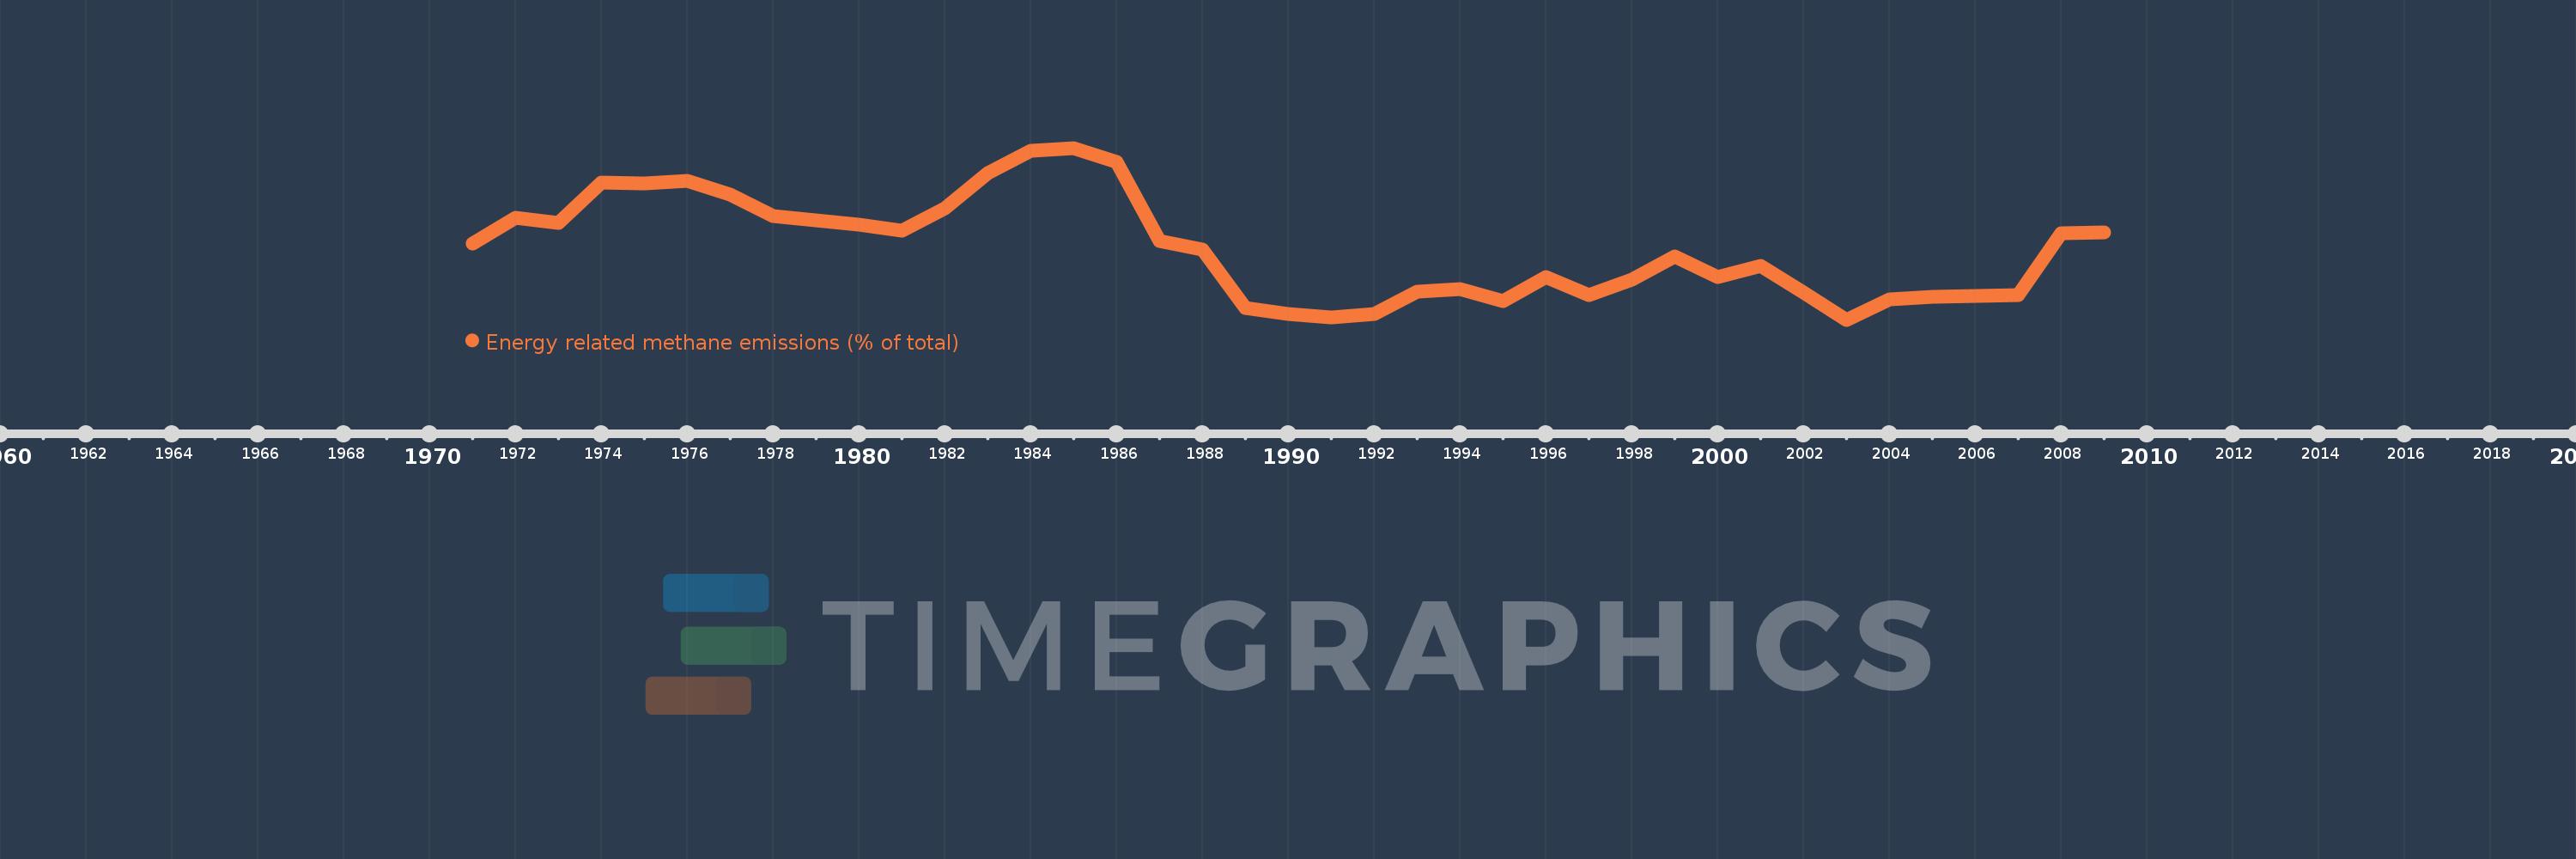
Energy related methane emissions (% of total)
2009,2008,2007,2006,2005,2004,2003,2002,2001,2000,1999,1998,1997,1996,1995,1994,1993,1992,1991,1990,1989,1988,1987,1986,1985,1984,1983,1982,1981,1980,1979,1978,1977,1976,1975,1974,1973,1972,1971
This statistics in other country:
AfghanistanAlbaniaAlgeriaAmerican SamoaAngolaAntigua and BarbudaArab WorldArgentinaArmeniaArubaAustraliaAustriaAzerbaijanBahamas, TheBahrainBangladeshBarbadosBelarusBelgiumBelizeBeninBermudaBhutanBoliviaBosnia and HerzegovinaBotswanaBrazilBritish Virgin IslandsBrunei DarussalamBulgariaBurkina FasoBurundiCabo VerdeCambodiaCameroonCanadaCaribbean small statesCayman IslandsCentral African RepublicCentral Europe and the BalticsChadChileChinaColombiaComorosCongo, Dem. Rep.Congo, Rep.Costa RicaCote d'IvoireCroatiaCubaCyprusCzech RepublicDenmarkDjiboutiDominicaDominican RepublicEarly-demographic dividendEast Asia & PacificEast Asia & Pacific (excluding high income)East Asia & Pacific (IDA & IBRD countries)EcuadorEgypt, Arab Rep.El SalvadorEquatorial GuineaEritreaEstoniaEthiopiaEuro areaEurope & Central AsiaEurope & Central Asia (excluding high income)Europe & Central Asia (IDA & IBRD countries)European UnionFaroe IslandsFijiFinlandFragile and conflict affected situationsFranceFrench PolynesiaGabonGambia, TheGeorgiaGermanyGhanaGibraltarGreeceGreenlandGrenadaGuamGuatemalaGuineaGuinea-BissauGuyanaHaitiHeavily indebted poor countries (HIPC)High incomeHondurasHong Kong SAR, ChinaHungaryIBRD onlyIcelandIDA & IBRD totalIDA blendIDA onlyIDA totalIndiaIndonesiaIran, Islamic Rep.IraqIrelandIsraelItalyJamaicaJapanJordanKazakhstanKenyaKiribatiKorea, Dem. People’s Rep.Korea, Rep.KuwaitKyrgyz RepublicLao PDRLate-demographic dividendLatin America & Caribbean Latin America & Caribbean (excluding high income)Latin America & the Caribbean (IDA & IBRD countries)LatviaLeast developed countries: UN classificationLebanonLesothoLiberiaLibyaLithuaniaLow & middle incomeLow incomeLower middle incomeLuxembourgMacao SAR, ChinaMacedonia, FYRMadagascarMalawiMalaysiaMaldivesMaliMaltaMarshall IslandsMauritaniaMauritiusMexicoMicronesia, Fed. Sts.Middle East & North AfricaMiddle East & North Africa (excluding high income)Middle East & North Africa (IDA & IBRD countries)Middle incomeMoldovaMongoliaMoroccoMozambiqueMyanmarNamibiaNauruNepalNetherlandsNew CaledoniaNew ZealandNicaraguaNigerNigeriaNorth AmericaNorthern Mariana IslandsNorwayOECD membersOmanOther small statesPacific island small statesPakistanPalauPanamaPapua New GuineaParaguayPeruPhilippinesPolandPortugalPost-demographic dividendPre-demographic dividendPuerto RicoQatarRomaniaRussian FederationRwandaSamoaSao Tome and PrincipeSaudi ArabiaSenegalSerbiaSeychellesSierra LeoneSingaporeSlovak RepublicSloveniaSmall statesSolomon IslandsSomaliaSouth AfricaSouth AsiaSouth Asia (IDA & IBRD)SpainSri LankaSt. Kitts and NevisSt. LuciaSt. Vincent and the GrenadinesSub-Saharan Africa Sub-Saharan Africa (excluding high income)Sub-Saharan Africa (IDA & IBRD countries)SudanSurinameSwazilandSwedenSwitzerlandSyrian Arab RepublicTajikistanTanzaniaThailandTimor-LesteTogoTongaTrinidad and TobagoTunisiaTurkeyTurkmenistanTurks and Caicos IslandsTuvaluUgandaUkraineUnited Arab EmiratesUnited KingdomUnited StatesUpper middle incomeUruguayUzbekistanVanuatuVenezuela, RBVietnamVirgin Islands (U.S.)WorldYemen, Rep.ZambiaZimbabwe Timeline:
This timeline shows a graph from 1971 to 2009 of El Salvador. No data until 1970. Number of actual observations by date: 39.
Source name:
World Development Indicators
Source organization:
World Bank staff estimates from original source: European Commission, Joint Research Centre (JRC)/Netherlands Environmental Assessment Agency (PBL). Emission Database for Global Atmospheric Research (EDGAR): http://edgar.jrc.ec.europa.eu/.
Categories, topics:
Energy & Mining, Environment
Last updated:
apr 23, 2017
Indicators value changes by year
Minimum:
12.105
jan 1, 2003
Maximum:
18.301
jan 1, 1985
At the date of observation
Value
Absolute change
Change from previous value
jan 1, 1971
14.858
+14.858
0.0%
jan 1, 1972
15.77
+0.912
6.14%
jan 1, 1973
15.611
-0.159
-1.01%
jan 1, 1974
17.063
+1.452
9.3%
jan 1, 1975
17.018
-0.046
-0.27%
jan 1, 1976
17.123
+0.106
0.62%
jan 1, 1977
16.634
-0.489
-2.86%
jan 1, 1978
15.844
-0.79
-4.75%
jan 1, 1979
15.68
-0.164
-1.04%
jan 1, 1980
15.523
-0.157
-1.0%
jan 1, 1981
15.305
-0.218
-1.41%
jan 1, 1982
16.12
+0.815
5.32%
jan 1, 1983
17.393
+1.273
7.9%
jan 1, 1984
18.189
+0.796
4.58%
jan 1, 1985
18.301
+0.112
0.61%
jan 1, 1986
17.808
-0.493
-2.69%
jan 1, 1987
14.958
-2.85
-16.0%
jan 1, 1988
14.625
-0.333
-2.23%
jan 1, 1989
12.54
-2.085
-14.26%
jan 1, 1990
12.323
-0.217
-1.73%
jan 1, 1991
12.189
-0.134
-1.08%
jan 1, 1992
12.322
+0.133
1.09%
jan 1, 1993
13.13
+0.808
6.56%
jan 1, 1994
13.22
+0.09
0.69%
jan 1, 1995
12.768
-0.452
-3.42%
jan 1, 1996
13.656
+0.888
6.96%
jan 1, 1997
12.981
-0.675
-4.94%
jan 1, 1998
13.537
+0.556
4.28%
jan 1, 1999
14.398
+0.862
6.36%
jan 1, 2000
13.654
-0.744
-5.17%
jan 1, 2001
14.048
+0.393
2.88%
jan 1, 2002
13.097
-0.95
-6.77%
jan 1, 2003
12.105
-0.992
-7.57%
jan 1, 2004
12.833
+0.727
6.01%
jan 1, 2005
12.946
+0.113
0.88%
jan 1, 2006
12.963
+0.018
0.14%
jan 1, 2007
12.997
+0.033
0.26%
jan 1, 2008
15.22
+2.224
17.11%
jan 1, 2009
15.245
+0.025
0.16%
Ranking of countries by current statistics by years


Comments: