29
/
en
AIzaSyAYiBZKx7MnpbEhh9jyipgxe19OcubqV5w
April 1, 2024
238189
Seychelles
SYC
true
2
1
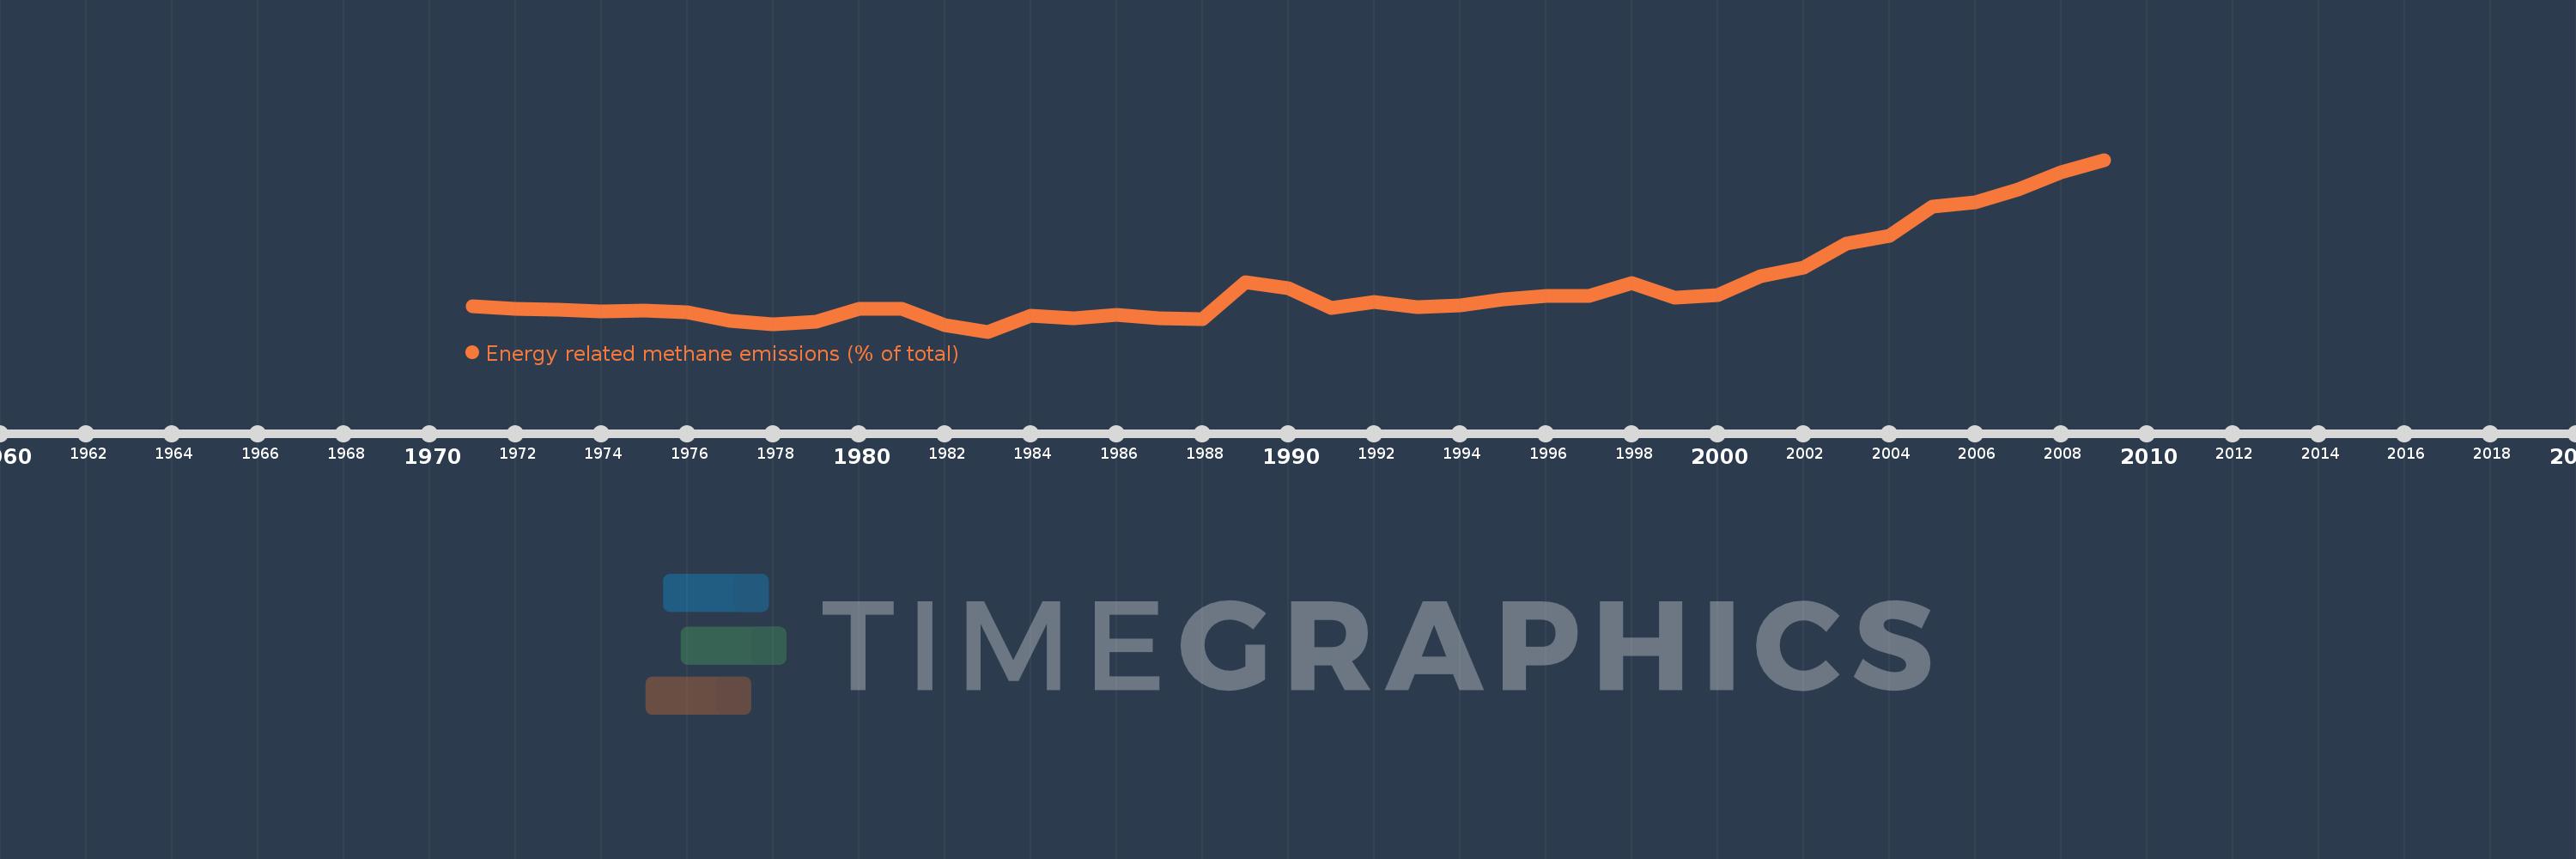
Energy related methane emissions (% of total)
2009,2008,2007,2006,2005,2004,2003,2002,2001,2000,1999,1998,1997,1996,1995,1994,1993,1992,1991,1990,1989,1988,1987,1986,1985,1984,1983,1982,1981,1980,1979,1978,1977,1976,1975,1974,1973,1972,1971
This statistics in other country:
AfghanistanAlbaniaAlgeriaAmerican SamoaAngolaAntigua and BarbudaArab WorldArgentinaArmeniaArubaAustraliaAustriaAzerbaijanBahamas, TheBahrainBangladeshBarbadosBelarusBelgiumBelizeBeninBermudaBhutanBoliviaBosnia and HerzegovinaBotswanaBrazilBritish Virgin IslandsBrunei DarussalamBulgariaBurkina FasoBurundiCabo VerdeCambodiaCameroonCanadaCaribbean small statesCayman IslandsCentral African RepublicCentral Europe and the BalticsChadChileChinaColombiaComorosCongo, Dem. Rep.Congo, Rep.Costa RicaCote d'IvoireCroatiaCubaCyprusCzech RepublicDenmarkDjiboutiDominicaDominican RepublicEarly-demographic dividendEast Asia & PacificEast Asia & Pacific (excluding high income)East Asia & Pacific (IDA & IBRD countries)EcuadorEgypt, Arab Rep.El SalvadorEquatorial GuineaEritreaEstoniaEthiopiaEuro areaEurope & Central AsiaEurope & Central Asia (excluding high income)Europe & Central Asia (IDA & IBRD countries)European UnionFaroe IslandsFijiFinlandFragile and conflict affected situationsFranceFrench PolynesiaGabonGambia, TheGeorgiaGermanyGhanaGibraltarGreeceGreenlandGrenadaGuamGuatemalaGuineaGuinea-BissauGuyanaHaitiHeavily indebted poor countries (HIPC)High incomeHondurasHong Kong SAR, ChinaHungaryIBRD onlyIcelandIDA & IBRD totalIDA blendIDA onlyIDA totalIndiaIndonesiaIran, Islamic Rep.IraqIrelandIsraelItalyJamaicaJapanJordanKazakhstanKenyaKiribatiKorea, Dem. People’s Rep.Korea, Rep.KuwaitKyrgyz RepublicLao PDRLate-demographic dividendLatin America & Caribbean Latin America & Caribbean (excluding high income)Latin America & the Caribbean (IDA & IBRD countries)LatviaLeast developed countries: UN classificationLebanonLesothoLiberiaLibyaLithuaniaLow & middle incomeLow incomeLower middle incomeLuxembourgMacao SAR, ChinaMacedonia, FYRMadagascarMalawiMalaysiaMaldivesMaliMaltaMarshall IslandsMauritaniaMauritiusMexicoMicronesia, Fed. Sts.Middle East & North AfricaMiddle East & North Africa (excluding high income)Middle East & North Africa (IDA & IBRD countries)Middle incomeMoldovaMongoliaMoroccoMozambiqueMyanmarNamibiaNauruNepalNetherlandsNew CaledoniaNew ZealandNicaraguaNigerNigeriaNorth AmericaNorthern Mariana IslandsNorwayOECD membersOmanOther small statesPacific island small statesPakistanPalauPanamaPapua New GuineaParaguayPeruPhilippinesPolandPortugalPost-demographic dividendPre-demographic dividendPuerto RicoQatarRomaniaRussian FederationRwandaSamoaSao Tome and PrincipeSaudi ArabiaSenegalSerbiaSeychellesSierra LeoneSingaporeSlovak RepublicSloveniaSmall statesSolomon IslandsSomaliaSouth AfricaSouth AsiaSouth Asia (IDA & IBRD)SpainSri LankaSt. Kitts and NevisSt. LuciaSt. Vincent and the GrenadinesSub-Saharan Africa Sub-Saharan Africa (excluding high income)Sub-Saharan Africa (IDA & IBRD countries)SudanSurinameSwazilandSwedenSwitzerlandSyrian Arab RepublicTajikistanTanzaniaThailandTimor-LesteTogoTongaTrinidad and TobagoTunisiaTurkeyTurkmenistanTurks and Caicos IslandsTuvaluUgandaUkraineUnited Arab EmiratesUnited KingdomUnited StatesUpper middle incomeUruguayUzbekistanVanuatuVenezuela, RBVietnamVirgin Islands (U.S.)WorldYemen, Rep.ZambiaZimbabwe Timeline:
This timeline shows a graph from 1971 to 2009 of Seychelles. No data until 1970. Number of actual observations by date: 39.
Source name:
World Development Indicators
Source organization:
World Bank staff estimates from original source: European Commission, Joint Research Centre (JRC)/Netherlands Environmental Assessment Agency (PBL). Emission Database for Global Atmospheric Research (EDGAR): http://edgar.jrc.ec.europa.eu/.
Categories, topics:
Energy & Mining, Environment
Last updated:
apr 23, 2017
Indicators value changes by year
Maximum:
16.005
jan 1, 2009
At the date of observation
Value
Absolute change
Change from previous value
jan 1, 1971
4.165
+4.165
0.0%
jan 1, 1972
3.949
-0.216
-5.18%
jan 1, 1973
3.831
-0.119
-3.0%
jan 1, 1974
3.734
-0.097
-2.52%
jan 1, 1975
3.819
+0.085
2.28%
jan 1, 1976
3.636
-0.183
-4.79%
jan 1, 1977
2.921
-0.715
-19.68%
jan 1, 1978
2.707
-0.213
-7.3%
jan 1, 1979
2.91
+0.202
7.47%
jan 1, 1980
3.934
+1.024
35.19%
jan 1, 1981
3.91
-0.024
-0.61%
jan 1, 1982
2.604
-1.305
-33.39%
jan 1, 1983
2.084
-0.521
-19.99%
jan 1, 1984
3.399
+1.316
63.16%
jan 1, 1985
3.197
-0.203
-5.96%
jan 1, 1986
3.428
+0.231
7.24%
jan 1, 1987
3.129
-0.299
-8.73%
jan 1, 1988
3.073
-0.055
-1.77%
jan 1, 1989
6.076
+3.002
97.69%
jan 1, 1990
5.605
-0.471
-7.75%
jan 1, 1991
3.988
-1.617
-28.86%
jan 1, 1992
4.473
+0.485
12.16%
jan 1, 1993
4.089
-0.384
-8.59%
jan 1, 1994
4.179
+0.091
2.22%
jan 1, 1995
4.697
+0.518
12.39%
jan 1, 1996
5.003
+0.306
6.51%
jan 1, 1997
4.939
-0.064
-1.28%
jan 1, 1998
6.002
+1.063
21.53%
jan 1, 1999
4.866
-1.136
-18.93%
jan 1, 2000
5.074
+0.208
4.28%
jan 1, 2001
6.551
+1.477
29.12%
jan 1, 2002
7.236
+0.685
10.46%
jan 1, 2003
9.243
+2.007
27.73%
jan 1, 2004
9.867
+0.623
6.74%
jan 1, 2005
12.193
+2.326
23.58%
jan 1, 2006
12.542
+0.35
2.87%
jan 1, 2007
13.578
+1.035
8.25%
jan 1, 2008
14.969
+1.392
10.25%
jan 1, 2009
16.005
+1.036
6.92%
Ranking of countries by current statistics by years


Comments: