29
/
en
AIzaSyAYiBZKx7MnpbEhh9jyipgxe19OcubqV5w
April 1, 2024
37302
IDA & IBRD total
IBT
false
2
1
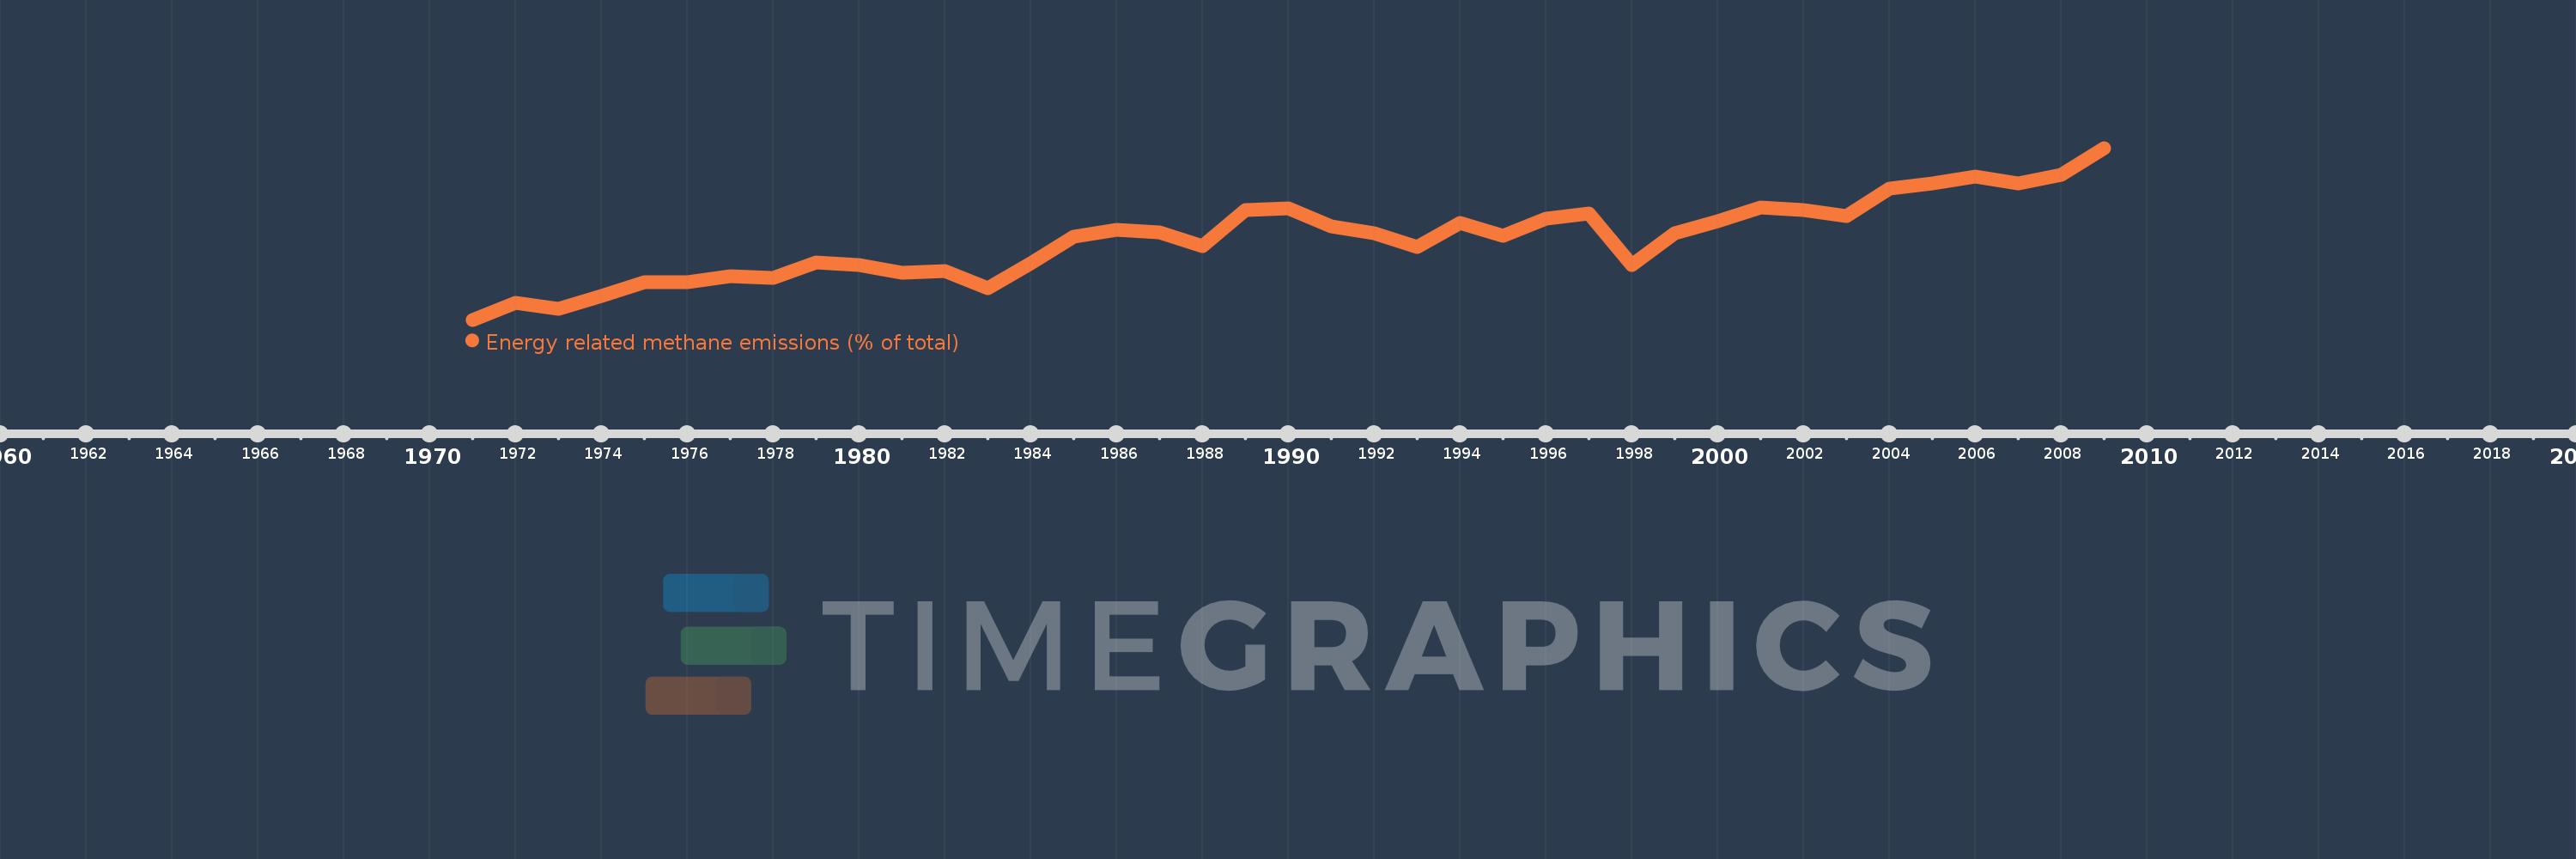
Energy related methane emissions (% of total)
2009,2008,2007,2006,2005,2004,2003,2002,2001,2000,1999,1998,1997,1996,1995,1994,1993,1992,1991,1990,1989,1988,1987,1986,1985,1984,1983,1982,1981,1980,1979,1978,1977,1976,1975,1974,1973,1972,1971
This statistics in other country:
AfghanistanAlbaniaAlgeriaAmerican SamoaAngolaAntigua and BarbudaArab WorldArgentinaArmeniaArubaAustraliaAustriaAzerbaijanBahamas, TheBahrainBangladeshBarbadosBelarusBelgiumBelizeBeninBermudaBhutanBoliviaBosnia and HerzegovinaBotswanaBrazilBritish Virgin IslandsBrunei DarussalamBulgariaBurkina FasoBurundiCabo VerdeCambodiaCameroonCanadaCaribbean small statesCayman IslandsCentral African RepublicCentral Europe and the BalticsChadChileChinaColombiaComorosCongo, Dem. Rep.Congo, Rep.Costa RicaCote d'IvoireCroatiaCubaCyprusCzech RepublicDenmarkDjiboutiDominicaDominican RepublicEarly-demographic dividendEast Asia & PacificEast Asia & Pacific (excluding high income)East Asia & Pacific (IDA & IBRD countries)EcuadorEgypt, Arab Rep.El SalvadorEquatorial GuineaEritreaEstoniaEthiopiaEuro areaEurope & Central AsiaEurope & Central Asia (excluding high income)Europe & Central Asia (IDA & IBRD countries)European UnionFaroe IslandsFijiFinlandFragile and conflict affected situationsFranceFrench PolynesiaGabonGambia, TheGeorgiaGermanyGhanaGibraltarGreeceGreenlandGrenadaGuamGuatemalaGuineaGuinea-BissauGuyanaHaitiHeavily indebted poor countries (HIPC)High incomeHondurasHong Kong SAR, ChinaHungaryIBRD onlyIcelandIDA & IBRD totalIDA blendIDA onlyIDA totalIndiaIndonesiaIran, Islamic Rep.IraqIrelandIsraelItalyJamaicaJapanJordanKazakhstanKenyaKiribatiKorea, Dem. People’s Rep.Korea, Rep.KuwaitKyrgyz RepublicLao PDRLate-demographic dividendLatin America & Caribbean Latin America & Caribbean (excluding high income)Latin America & the Caribbean (IDA & IBRD countries)LatviaLeast developed countries: UN classificationLebanonLesothoLiberiaLibyaLithuaniaLow & middle incomeLow incomeLower middle incomeLuxembourgMacao SAR, ChinaMacedonia, FYRMadagascarMalawiMalaysiaMaldivesMaliMaltaMarshall IslandsMauritaniaMauritiusMexicoMicronesia, Fed. Sts.Middle East & North AfricaMiddle East & North Africa (excluding high income)Middle East & North Africa (IDA & IBRD countries)Middle incomeMoldovaMongoliaMoroccoMozambiqueMyanmarNamibiaNauruNepalNetherlandsNew CaledoniaNew ZealandNicaraguaNigerNigeriaNorth AmericaNorthern Mariana IslandsNorwayOECD membersOmanOther small statesPacific island small statesPakistanPalauPanamaPapua New GuineaParaguayPeruPhilippinesPolandPortugalPost-demographic dividendPre-demographic dividendPuerto RicoQatarRomaniaRussian FederationRwandaSamoaSao Tome and PrincipeSaudi ArabiaSenegalSerbiaSeychellesSierra LeoneSingaporeSlovak RepublicSloveniaSmall statesSolomon IslandsSomaliaSouth AfricaSouth AsiaSouth Asia (IDA & IBRD)SpainSri LankaSt. Kitts and NevisSt. LuciaSt. Vincent and the GrenadinesSub-Saharan Africa Sub-Saharan Africa (excluding high income)Sub-Saharan Africa (IDA & IBRD countries)SudanSurinameSwazilandSwedenSwitzerlandSyrian Arab RepublicTajikistanTanzaniaThailandTimor-LesteTogoTongaTrinidad and TobagoTunisiaTurkeyTurkmenistanTurks and Caicos IslandsTuvaluUgandaUkraineUnited Arab EmiratesUnited KingdomUnited StatesUpper middle incomeUruguayUzbekistanVanuatuVenezuela, RBVietnamVirgin Islands (U.S.)WorldYemen, Rep.ZambiaZimbabwe Timeline:
This timeline shows a graph from 1971 to 2009 of IDA & IBRD total. No data until 1970. Number of actual observations by date: 39.
Source name:
World Development Indicators
Source organization:
World Bank staff estimates from original source: European Commission, Joint Research Centre (JRC)/Netherlands Environmental Assessment Agency (PBL). Emission Database for Global Atmospheric Research (EDGAR): http://edgar.jrc.ec.europa.eu/.
Categories, topics:
Energy & Mining, Environment
Last updated:
apr 23, 2017
Indicators value changes by year
Minimum:
23.613
jan 1, 1971
Maximum:
36.467
jan 1, 2009
At the date of observation
Value
Absolute change
Change from previous value
jan 1, 1971
23.613
+23.613
0.0%
jan 1, 1972
24.884
+1.271
5.38%
jan 1, 1973
24.4
-0.484
-1.94%
jan 1, 1974
25.405
+1.005
4.12%
jan 1, 1975
26.426
+1.021
4.02%
jan 1, 1976
26.393
-0.033
-0.13%
jan 1, 1977
26.882
+0.489
1.85%
jan 1, 1978
26.771
-0.111
-0.41%
jan 1, 1979
27.868
+1.097
4.1%
jan 1, 1980
27.678
-0.19
-0.68%
jan 1, 1981
27.134
-0.544
-1.97%
jan 1, 1982
27.268
+0.134
0.49%
jan 1, 1983
25.945
-1.323
-4.85%
jan 1, 1984
27.805
+1.86
7.17%
jan 1, 1985
29.801
+1.997
7.18%
jan 1, 1986
30.331
+0.53
1.78%
jan 1, 1987
30.131
-0.2
-0.66%
jan 1, 1988
29.113
-1.018
-3.38%
jan 1, 1989
31.851
+2.737
9.4%
jan 1, 1990
31.97
+0.12
0.38%
jan 1, 1991
30.591
-1.379
-4.31%
jan 1, 1992
30.075
-0.517
-1.69%
jan 1, 1993
29.025
-1.05
-3.49%
jan 1, 1994
30.847
+1.822
6.28%
jan 1, 1995
29.912
-0.935
-3.03%
jan 1, 1996
31.148
+1.236
4.13%
jan 1, 1997
31.591
+0.443
1.42%
jan 1, 1998
27.68
-3.911
-12.38%
jan 1, 1999
30.061
+2.381
8.6%
jan 1, 2000
30.969
+0.908
3.02%
jan 1, 2001
32.028
+1.06
3.42%
jan 1, 2002
31.82
-0.208
-0.65%
jan 1, 2003
31.39
-0.43
-1.35%
jan 1, 2004
33.45
+2.06
6.56%
jan 1, 2005
33.833
+0.383
1.14%
jan 1, 2006
34.315
+0.482
1.42%
jan 1, 2007
33.791
-0.524
-1.53%
jan 1, 2008
34.454
+0.663
1.96%
jan 1, 2009
36.467
+2.014
5.84%
Ranking of countries by current statistics by years


Comments: