29
/
en
AIzaSyAYiBZKx7MnpbEhh9jyipgxe19OcubqV5w
April 1, 2024
167400
Kenya
KEN
true
2
1
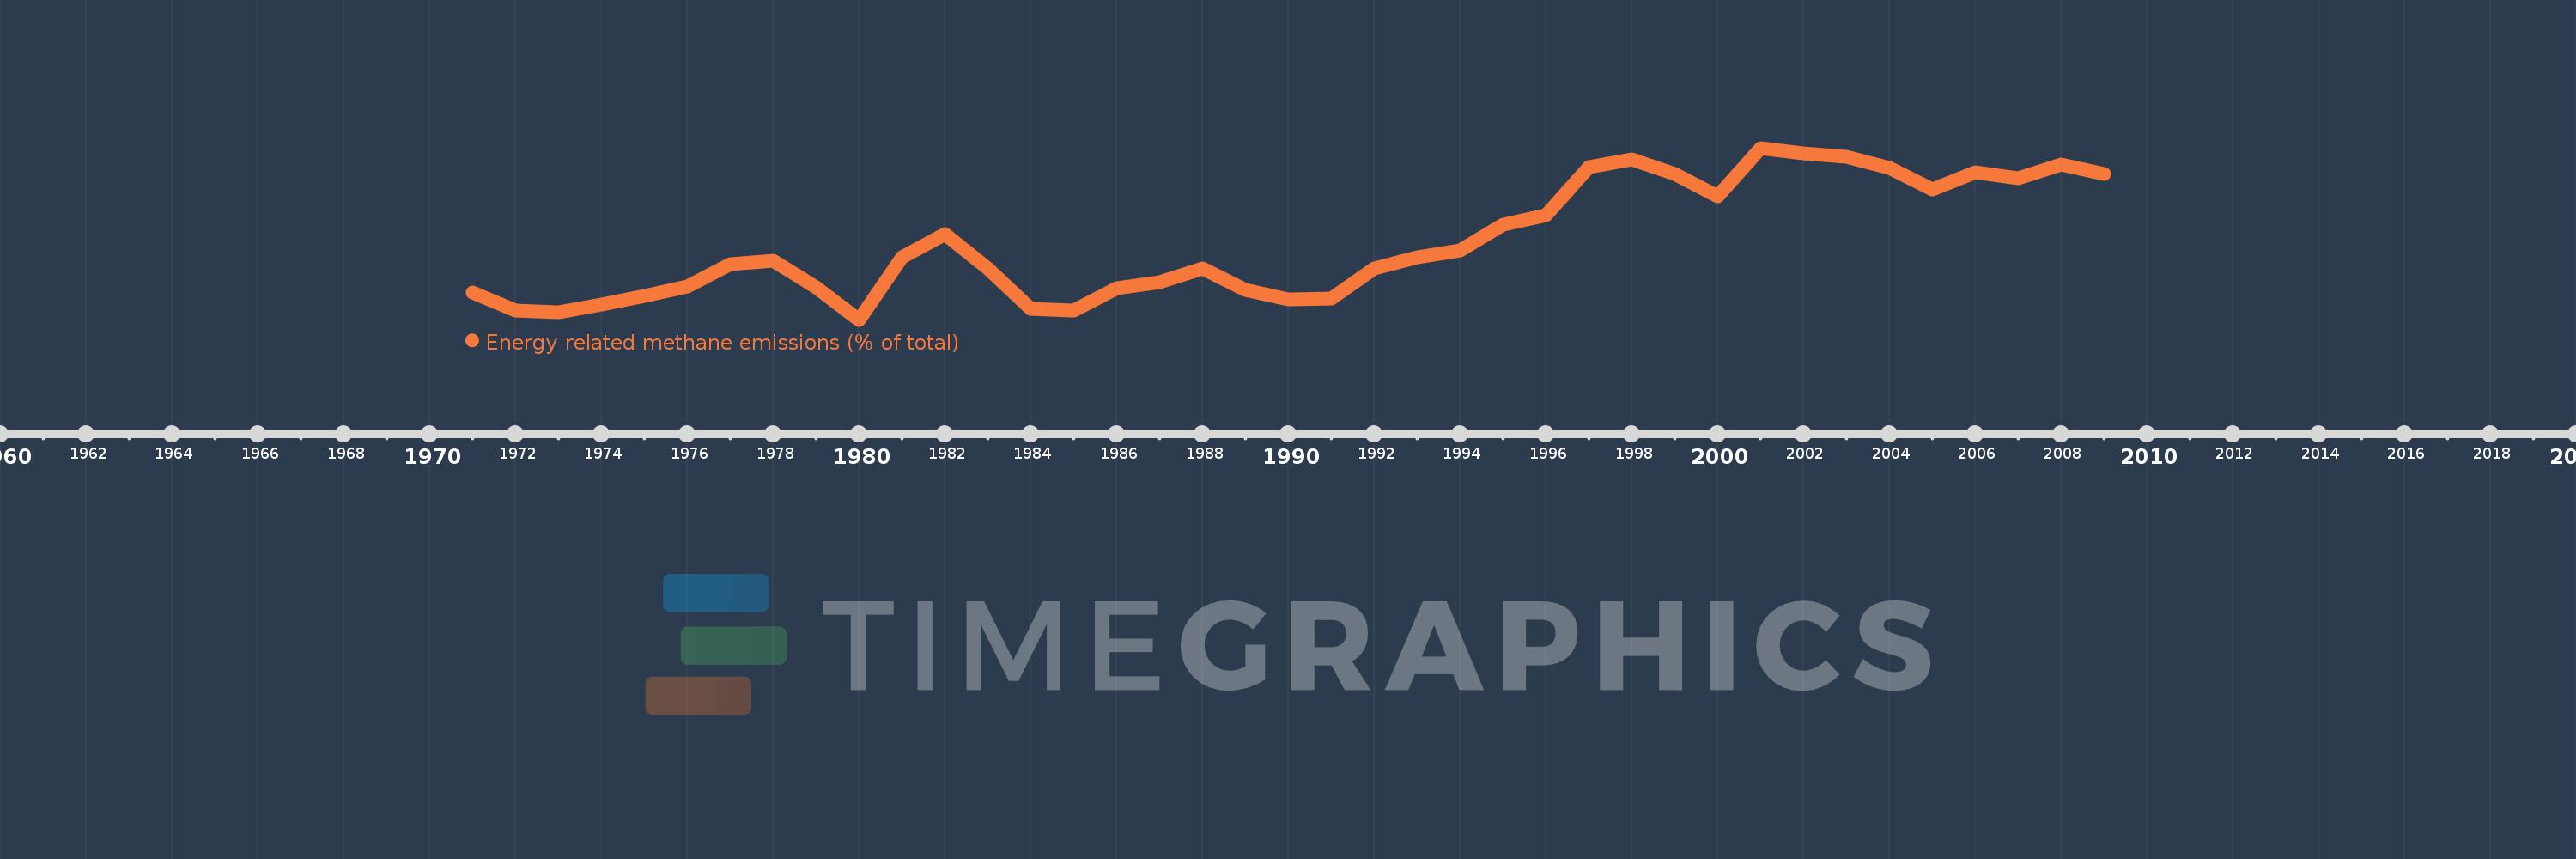
Energy related methane emissions (% of total)
2009,2008,2007,2006,2005,2004,2003,2002,2001,2000,1999,1998,1997,1996,1995,1994,1993,1992,1991,1990,1989,1988,1987,1986,1985,1984,1983,1982,1981,1980,1979,1978,1977,1976,1975,1974,1973,1972,1971
This statistics in other country:
AfghanistanAlbaniaAlgeriaAmerican SamoaAngolaAntigua and BarbudaArab WorldArgentinaArmeniaArubaAustraliaAustriaAzerbaijanBahamas, TheBahrainBangladeshBarbadosBelarusBelgiumBelizeBeninBermudaBhutanBoliviaBosnia and HerzegovinaBotswanaBrazilBritish Virgin IslandsBrunei DarussalamBulgariaBurkina FasoBurundiCabo VerdeCambodiaCameroonCanadaCaribbean small statesCayman IslandsCentral African RepublicCentral Europe and the BalticsChadChileChinaColombiaComorosCongo, Dem. Rep.Congo, Rep.Costa RicaCote d'IvoireCroatiaCubaCyprusCzech RepublicDenmarkDjiboutiDominicaDominican RepublicEarly-demographic dividendEast Asia & PacificEast Asia & Pacific (excluding high income)East Asia & Pacific (IDA & IBRD countries)EcuadorEgypt, Arab Rep.El SalvadorEquatorial GuineaEritreaEstoniaEthiopiaEuro areaEurope & Central AsiaEurope & Central Asia (excluding high income)Europe & Central Asia (IDA & IBRD countries)European UnionFaroe IslandsFijiFinlandFragile and conflict affected situationsFranceFrench PolynesiaGabonGambia, TheGeorgiaGermanyGhanaGibraltarGreeceGreenlandGrenadaGuamGuatemalaGuineaGuinea-BissauGuyanaHaitiHeavily indebted poor countries (HIPC)High incomeHondurasHong Kong SAR, ChinaHungaryIBRD onlyIcelandIDA & IBRD totalIDA blendIDA onlyIDA totalIndiaIndonesiaIran, Islamic Rep.IraqIrelandIsraelItalyJamaicaJapanJordanKazakhstanKenyaKiribatiKorea, Dem. People’s Rep.Korea, Rep.KuwaitKyrgyz RepublicLao PDRLate-demographic dividendLatin America & Caribbean Latin America & Caribbean (excluding high income)Latin America & the Caribbean (IDA & IBRD countries)LatviaLeast developed countries: UN classificationLebanonLesothoLiberiaLibyaLithuaniaLow & middle incomeLow incomeLower middle incomeLuxembourgMacao SAR, ChinaMacedonia, FYRMadagascarMalawiMalaysiaMaldivesMaliMaltaMarshall IslandsMauritaniaMauritiusMexicoMicronesia, Fed. Sts.Middle East & North AfricaMiddle East & North Africa (excluding high income)Middle East & North Africa (IDA & IBRD countries)Middle incomeMoldovaMongoliaMoroccoMozambiqueMyanmarNamibiaNauruNepalNetherlandsNew CaledoniaNew ZealandNicaraguaNigerNigeriaNorth AmericaNorthern Mariana IslandsNorwayOECD membersOmanOther small statesPacific island small statesPakistanPalauPanamaPapua New GuineaParaguayPeruPhilippinesPolandPortugalPost-demographic dividendPre-demographic dividendPuerto RicoQatarRomaniaRussian FederationRwandaSamoaSao Tome and PrincipeSaudi ArabiaSenegalSerbiaSeychellesSierra LeoneSingaporeSlovak RepublicSloveniaSmall statesSolomon IslandsSomaliaSouth AfricaSouth AsiaSouth Asia (IDA & IBRD)SpainSri LankaSt. Kitts and NevisSt. LuciaSt. Vincent and the GrenadinesSub-Saharan Africa Sub-Saharan Africa (excluding high income)Sub-Saharan Africa (IDA & IBRD countries)SudanSurinameSwazilandSwedenSwitzerlandSyrian Arab RepublicTajikistanTanzaniaThailandTimor-LesteTogoTongaTrinidad and TobagoTunisiaTurkeyTurkmenistanTurks and Caicos IslandsTuvaluUgandaUkraineUnited Arab EmiratesUnited KingdomUnited StatesUpper middle incomeUruguayUzbekistanVanuatuVenezuela, RBVietnamVirgin Islands (U.S.)WorldYemen, Rep.ZambiaZimbabwe Timeline:
This timeline shows a graph from 1971 to 2009 of Kenya. No data until 1970. Number of actual observations by date: 39.
Source name:
World Development Indicators
Source organization:
World Bank staff estimates from original source: European Commission, Joint Research Centre (JRC)/Netherlands Environmental Assessment Agency (PBL). Emission Database for Global Atmospheric Research (EDGAR): http://edgar.jrc.ec.europa.eu/.
Categories, topics:
Energy & Mining, Environment
Last updated:
apr 23, 2017
Indicators value changes by year
Minimum:
23.155
jan 1, 1980
Maximum:
28.997
jan 1, 2001
At the date of observation
Value
Absolute change
Change from previous value
jan 1, 1971
24.092
+24.092
0.0%
jan 1, 1972
23.461
-0.631
-2.62%
jan 1, 1973
23.4
-0.061
-0.26%
jan 1, 1974
23.668
+0.268
1.15%
jan 1, 1975
23.97
+0.302
1.27%
jan 1, 1976
24.273
+0.303
1.26%
jan 1, 1977
25.054
+0.781
3.22%
jan 1, 1978
25.172
+0.118
0.47%
jan 1, 1979
24.25
-0.922
-3.66%
jan 1, 1980
23.155
-1.095
-4.52%
jan 1, 1981
25.264
+2.109
9.11%
jan 1, 1982
26.058
+0.794
3.14%
jan 1, 1983
24.895
-1.163
-4.46%
jan 1, 1984
23.533
-1.362
-5.47%
jan 1, 1985
23.457
-0.076
-0.32%
jan 1, 1986
24.229
+0.773
3.29%
jan 1, 1987
24.428
+0.199
0.82%
jan 1, 1988
24.901
+0.472
1.93%
jan 1, 1989
24.167
-0.734
-2.95%
jan 1, 1990
23.858
-0.309
-1.28%
jan 1, 1991
23.87
+0.012
0.05%
jan 1, 1992
24.91
+1.04
4.36%
jan 1, 1993
25.282
+0.372
1.49%
jan 1, 1994
25.521
+0.238
0.94%
jan 1, 1995
26.38
+0.859
3.37%
jan 1, 1996
26.719
+0.339
1.29%
jan 1, 1997
28.345
+1.626
6.09%
jan 1, 1998
28.61
+0.264
0.93%
jan 1, 1999
28.12
-0.49
-1.71%
jan 1, 2000
27.342
-0.778
-2.77%
jan 1, 2001
28.997
+1.655
6.05%
jan 1, 2002
28.814
-0.183
-0.63%
jan 1, 2003
28.691
-0.123
-0.43%
jan 1, 2004
28.306
-0.385
-1.34%
jan 1, 2005
27.574
-0.731
-2.58%
jan 1, 2006
28.172
+0.597
2.17%
jan 1, 2007
27.975
-0.196
-0.7%
jan 1, 2008
28.436
+0.461
1.65%
jan 1, 2009
28.121
-0.315
-1.11%
Ranking of countries by current statistics by years


Comments: