29
/
en
AIzaSyAYiBZKx7MnpbEhh9jyipgxe19OcubqV5w
April 1, 2024
51802
North America
NAC
false
2
1
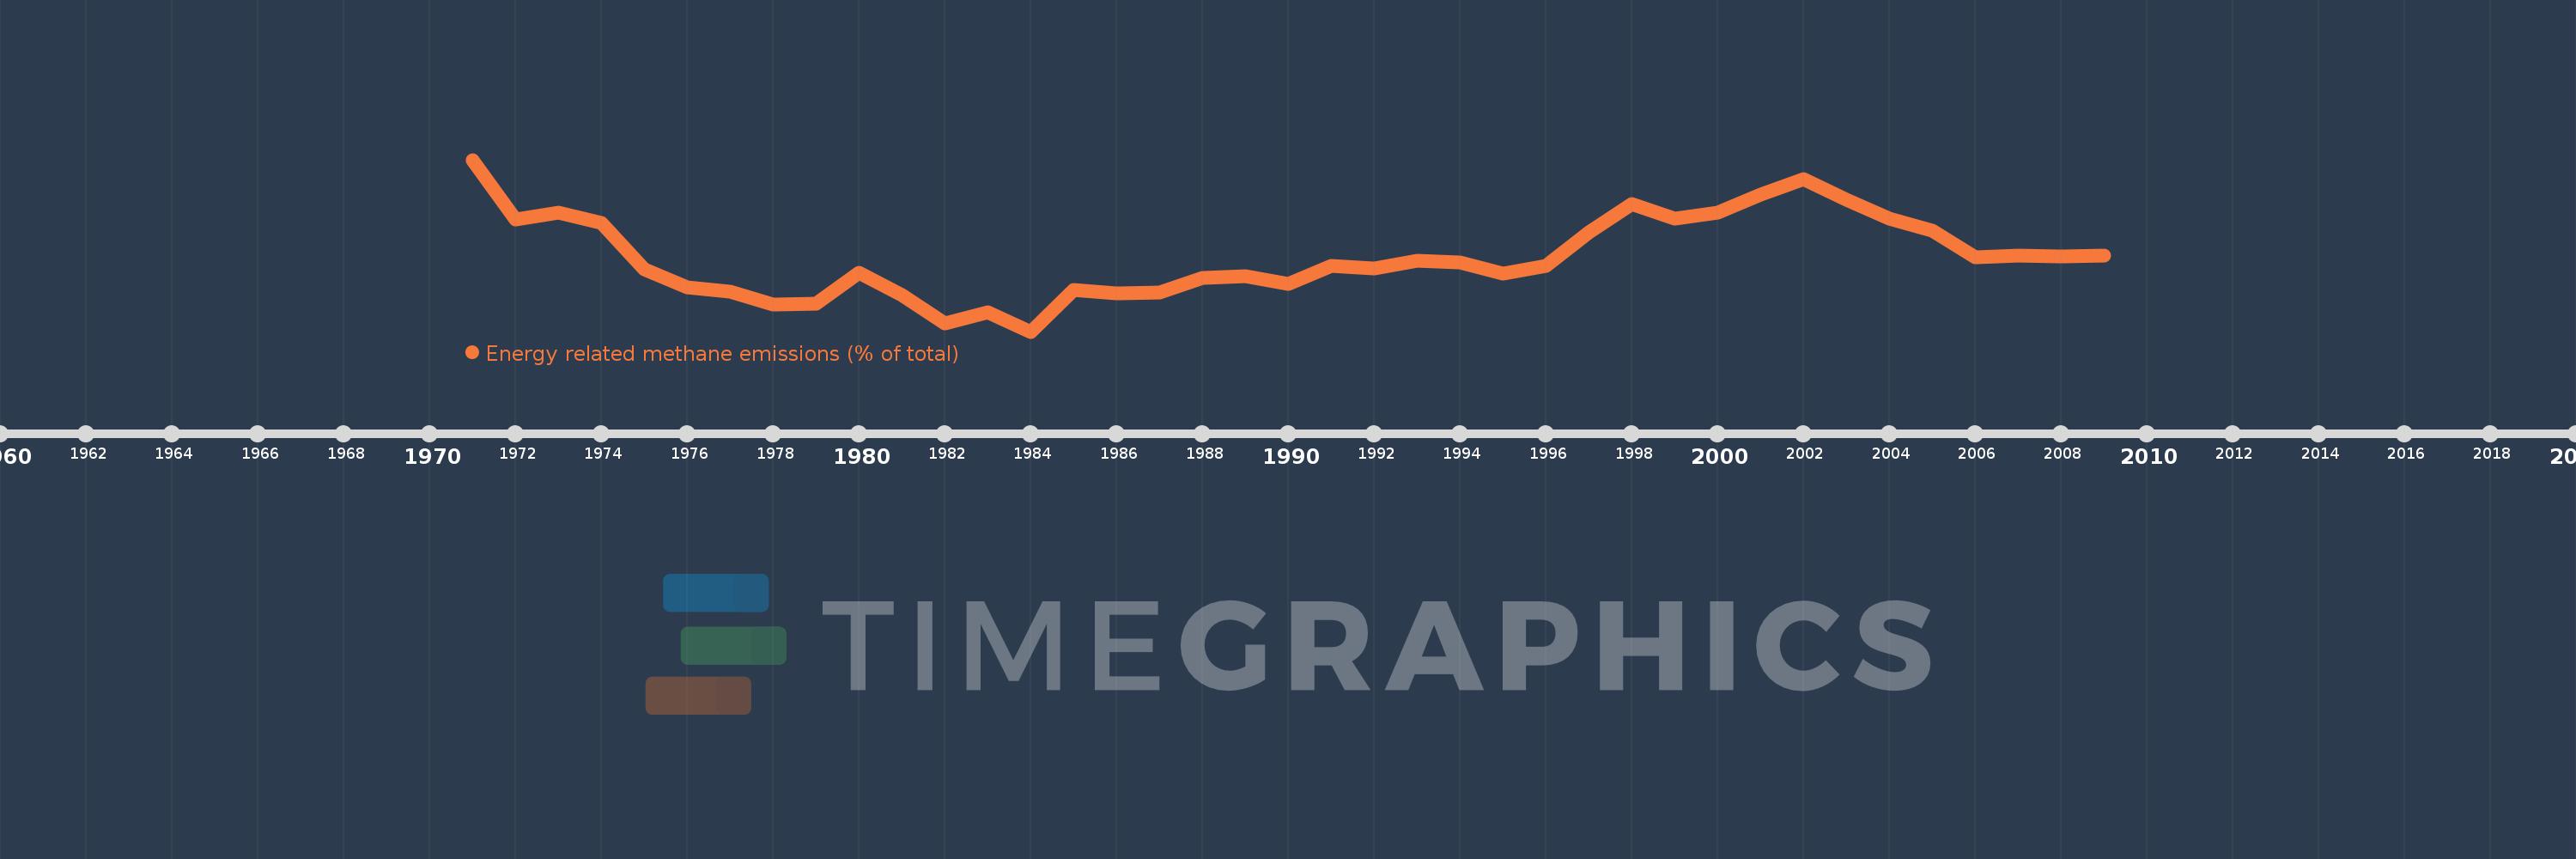
Energy related methane emissions (% of total)
2009,2008,2007,2006,2005,2004,2003,2002,2001,2000,1999,1998,1997,1996,1995,1994,1993,1992,1991,1990,1989,1988,1987,1986,1985,1984,1983,1982,1981,1980,1979,1978,1977,1976,1975,1974,1973,1972,1971
This statistics in other country:
AfghanistanAlbaniaAlgeriaAmerican SamoaAngolaAntigua and BarbudaArab WorldArgentinaArmeniaArubaAustraliaAustriaAzerbaijanBahamas, TheBahrainBangladeshBarbadosBelarusBelgiumBelizeBeninBermudaBhutanBoliviaBosnia and HerzegovinaBotswanaBrazilBritish Virgin IslandsBrunei DarussalamBulgariaBurkina FasoBurundiCabo VerdeCambodiaCameroonCanadaCaribbean small statesCayman IslandsCentral African RepublicCentral Europe and the BalticsChadChileChinaColombiaComorosCongo, Dem. Rep.Congo, Rep.Costa RicaCote d'IvoireCroatiaCubaCyprusCzech RepublicDenmarkDjiboutiDominicaDominican RepublicEarly-demographic dividendEast Asia & PacificEast Asia & Pacific (excluding high income)East Asia & Pacific (IDA & IBRD countries)EcuadorEgypt, Arab Rep.El SalvadorEquatorial GuineaEritreaEstoniaEthiopiaEuro areaEurope & Central AsiaEurope & Central Asia (excluding high income)Europe & Central Asia (IDA & IBRD countries)European UnionFaroe IslandsFijiFinlandFragile and conflict affected situationsFranceFrench PolynesiaGabonGambia, TheGeorgiaGermanyGhanaGibraltarGreeceGreenlandGrenadaGuamGuatemalaGuineaGuinea-BissauGuyanaHaitiHeavily indebted poor countries (HIPC)High incomeHondurasHong Kong SAR, ChinaHungaryIBRD onlyIcelandIDA & IBRD totalIDA blendIDA onlyIDA totalIndiaIndonesiaIran, Islamic Rep.IraqIrelandIsraelItalyJamaicaJapanJordanKazakhstanKenyaKiribatiKorea, Dem. People’s Rep.Korea, Rep.KuwaitKyrgyz RepublicLao PDRLate-demographic dividendLatin America & Caribbean Latin America & Caribbean (excluding high income)Latin America & the Caribbean (IDA & IBRD countries)LatviaLeast developed countries: UN classificationLebanonLesothoLiberiaLibyaLithuaniaLow & middle incomeLow incomeLower middle incomeLuxembourgMacao SAR, ChinaMacedonia, FYRMadagascarMalawiMalaysiaMaldivesMaliMaltaMarshall IslandsMauritaniaMauritiusMexicoMicronesia, Fed. Sts.Middle East & North AfricaMiddle East & North Africa (excluding high income)Middle East & North Africa (IDA & IBRD countries)Middle incomeMoldovaMongoliaMoroccoMozambiqueMyanmarNamibiaNauruNepalNetherlandsNew CaledoniaNew ZealandNicaraguaNigerNigeriaNorth AmericaNorthern Mariana IslandsNorwayOECD membersOmanOther small statesPacific island small statesPakistanPalauPanamaPapua New GuineaParaguayPeruPhilippinesPolandPortugalPost-demographic dividendPre-demographic dividendPuerto RicoQatarRomaniaRussian FederationRwandaSamoaSao Tome and PrincipeSaudi ArabiaSenegalSerbiaSeychellesSierra LeoneSingaporeSlovak RepublicSloveniaSmall statesSolomon IslandsSomaliaSouth AfricaSouth AsiaSouth Asia (IDA & IBRD)SpainSri LankaSt. Kitts and NevisSt. LuciaSt. Vincent and the GrenadinesSub-Saharan Africa Sub-Saharan Africa (excluding high income)Sub-Saharan Africa (IDA & IBRD countries)SudanSurinameSwazilandSwedenSwitzerlandSyrian Arab RepublicTajikistanTanzaniaThailandTimor-LesteTogoTongaTrinidad and TobagoTunisiaTurkeyTurkmenistanTurks and Caicos IslandsTuvaluUgandaUkraineUnited Arab EmiratesUnited KingdomUnited StatesUpper middle incomeUruguayUzbekistanVanuatuVenezuela, RBVietnamVirgin Islands (U.S.)WorldYemen, Rep.ZambiaZimbabwe Timeline:
This timeline shows a graph from 1971 to 2009 of North America. No data until 1970. Number of actual observations by date: 39.
Source name:
World Development Indicators
Source organization:
World Bank staff estimates from original source: European Commission, Joint Research Centre (JRC)/Netherlands Environmental Assessment Agency (PBL). Emission Database for Global Atmospheric Research (EDGAR): http://edgar.jrc.ec.europa.eu/.
Categories, topics:
Energy & Mining, Environment
Last updated:
apr 23, 2017
Indicators value changes by year
Minimum:
37.114
jan 1, 1984
Maximum:
44.578
jan 1, 1971
At the date of observation
Value
Absolute change
Change from previous value
jan 1, 1971
44.578
+44.578
0.0%
jan 1, 1972
41.967
-2.611
-5.86%
jan 1, 1973
42.269
+0.302
0.72%
jan 1, 1974
41.836
-0.433
-1.02%
jan 1, 1975
39.814
-2.022
-4.83%
jan 1, 1976
39.022
-0.792
-1.99%
jan 1, 1977
38.832
-0.19
-0.49%
jan 1, 1978
38.287
-0.545
-1.4%
jan 1, 1979
38.315
+0.028
0.07%
jan 1, 1980
39.656
+1.341
3.5%
jan 1, 1981
38.697
-0.959
-2.42%
jan 1, 1982
37.472
-1.225
-3.17%
jan 1, 1983
37.963
+0.491
1.31%
jan 1, 1984
37.114
-0.848
-2.23%
jan 1, 1985
38.934
+1.82
4.9%
jan 1, 1986
38.791
-0.143
-0.37%
jan 1, 1987
38.82
+0.029
0.07%
jan 1, 1988
39.446
+0.626
1.61%
jan 1, 1989
39.526
+0.08
0.2%
jan 1, 1990
39.167
-0.359
-0.91%
jan 1, 1991
39.965
+0.798
2.04%
jan 1, 1992
39.858
-0.107
-0.27%
jan 1, 1993
40.192
+0.334
0.84%
jan 1, 1994
40.109
-0.083
-0.21%
jan 1, 1995
39.64
-0.469
-1.17%
jan 1, 1996
39.967
+0.327
0.83%
jan 1, 1997
41.412
+1.445
3.61%
jan 1, 1998
42.643
+1.231
2.97%
jan 1, 1999
42.017
-0.626
-1.47%
jan 1, 2000
42.277
+0.259
0.62%
jan 1, 2001
43.078
+0.801
1.9%
jan 1, 2002
43.729
+0.652
1.51%
jan 1, 2003
42.837
-0.892
-2.04%
jan 1, 2004
42.007
-0.83
-1.94%
jan 1, 2005
41.482
-0.525
-1.25%
jan 1, 2006
40.342
-1.14
-2.75%
jan 1, 2007
40.422
+0.08
0.2%
jan 1, 2008
40.365
-0.058
-0.14%
jan 1, 2009
40.404
+0.039
0.1%
Ranking of countries by current statistics by years


Comments: