29
/
en
AIzaSyAYiBZKx7MnpbEhh9jyipgxe19OcubqV5w
April 1, 2024
65912
Algeria
DZA
true
2
1
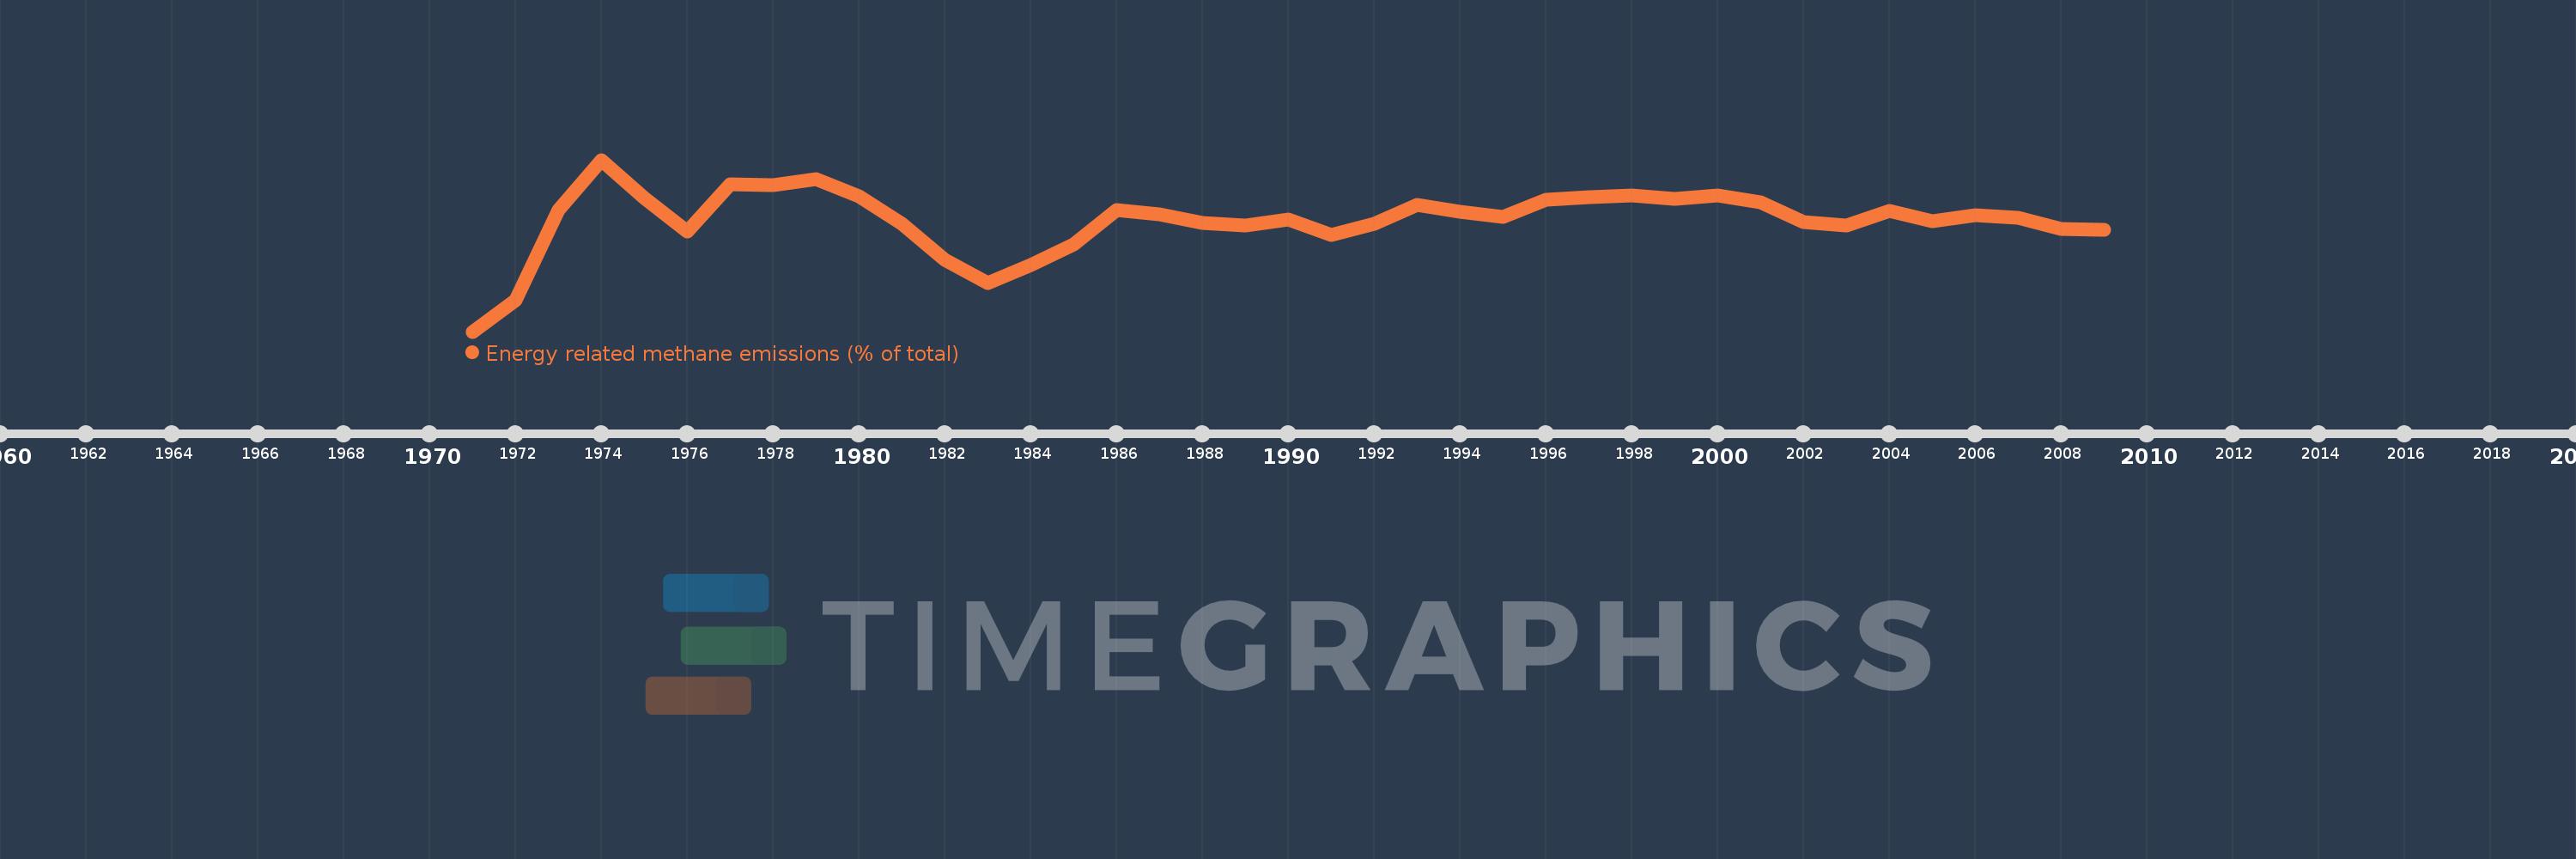
Energy related methane emissions (% of total)
2009,2008,2007,2006,2005,2004,2003,2002,2001,2000,1999,1998,1997,1996,1995,1994,1993,1992,1991,1990,1989,1988,1987,1986,1985,1984,1983,1982,1981,1980,1979,1978,1977,1976,1975,1974,1973,1972,1971
This statistics in other country:
AfghanistanAlbaniaAlgeriaAmerican SamoaAngolaAntigua and BarbudaArab WorldArgentinaArmeniaArubaAustraliaAustriaAzerbaijanBahamas, TheBahrainBangladeshBarbadosBelarusBelgiumBelizeBeninBermudaBhutanBoliviaBosnia and HerzegovinaBotswanaBrazilBritish Virgin IslandsBrunei DarussalamBulgariaBurkina FasoBurundiCabo VerdeCambodiaCameroonCanadaCaribbean small statesCayman IslandsCentral African RepublicCentral Europe and the BalticsChadChileChinaColombiaComorosCongo, Dem. Rep.Congo, Rep.Costa RicaCote d'IvoireCroatiaCubaCyprusCzech RepublicDenmarkDjiboutiDominicaDominican RepublicEarly-demographic dividendEast Asia & PacificEast Asia & Pacific (excluding high income)East Asia & Pacific (IDA & IBRD countries)EcuadorEgypt, Arab Rep.El SalvadorEquatorial GuineaEritreaEstoniaEthiopiaEuro areaEurope & Central AsiaEurope & Central Asia (excluding high income)Europe & Central Asia (IDA & IBRD countries)European UnionFaroe IslandsFijiFinlandFragile and conflict affected situationsFranceFrench PolynesiaGabonGambia, TheGeorgiaGermanyGhanaGibraltarGreeceGreenlandGrenadaGuamGuatemalaGuineaGuinea-BissauGuyanaHaitiHeavily indebted poor countries (HIPC)High incomeHondurasHong Kong SAR, ChinaHungaryIBRD onlyIcelandIDA & IBRD totalIDA blendIDA onlyIDA totalIndiaIndonesiaIran, Islamic Rep.IraqIrelandIsraelItalyJamaicaJapanJordanKazakhstanKenyaKiribatiKorea, Dem. People’s Rep.Korea, Rep.KuwaitKyrgyz RepublicLao PDRLate-demographic dividendLatin America & Caribbean Latin America & Caribbean (excluding high income)Latin America & the Caribbean (IDA & IBRD countries)LatviaLeast developed countries: UN classificationLebanonLesothoLiberiaLibyaLithuaniaLow & middle incomeLow incomeLower middle incomeLuxembourgMacao SAR, ChinaMacedonia, FYRMadagascarMalawiMalaysiaMaldivesMaliMaltaMarshall IslandsMauritaniaMauritiusMexicoMicronesia, Fed. Sts.Middle East & North AfricaMiddle East & North Africa (excluding high income)Middle East & North Africa (IDA & IBRD countries)Middle incomeMoldovaMongoliaMoroccoMozambiqueMyanmarNamibiaNauruNepalNetherlandsNew CaledoniaNew ZealandNicaraguaNigerNigeriaNorth AmericaNorthern Mariana IslandsNorwayOECD membersOmanOther small statesPacific island small statesPakistanPalauPanamaPapua New GuineaParaguayPeruPhilippinesPolandPortugalPost-demographic dividendPre-demographic dividendPuerto RicoQatarRomaniaRussian FederationRwandaSamoaSao Tome and PrincipeSaudi ArabiaSenegalSerbiaSeychellesSierra LeoneSingaporeSlovak RepublicSloveniaSmall statesSolomon IslandsSomaliaSouth AfricaSouth AsiaSouth Asia (IDA & IBRD)SpainSri LankaSt. Kitts and NevisSt. LuciaSt. Vincent and the GrenadinesSub-Saharan Africa Sub-Saharan Africa (excluding high income)Sub-Saharan Africa (IDA & IBRD countries)SudanSurinameSwazilandSwedenSwitzerlandSyrian Arab RepublicTajikistanTanzaniaThailandTimor-LesteTogoTongaTrinidad and TobagoTunisiaTurkeyTurkmenistanTurks and Caicos IslandsTuvaluUgandaUkraineUnited Arab EmiratesUnited KingdomUnited StatesUpper middle incomeUruguayUzbekistanVanuatuVenezuela, RBVietnamVirgin Islands (U.S.)WorldYemen, Rep.ZambiaZimbabwe Timeline:
This timeline shows a graph from 1971 to 2009 of Algeria. No data until 1970. Number of actual observations by date: 39.
Source name:
World Development Indicators
Source organization:
World Bank staff estimates from original source: European Commission, Joint Research Centre (JRC)/Netherlands Environmental Assessment Agency (PBL). Emission Database for Global Atmospheric Research (EDGAR): http://edgar.jrc.ec.europa.eu/.
Categories, topics:
Energy & Mining, Environment
Last updated:
apr 23, 2017
Indicators value changes by year
Maximum:
84.699
jan 1, 1974
At the date of observation
Value
Absolute change
Change from previous value
jan 1, 1971
71.57
+71.57
0.0%
jan 1, 1972
73.986
+2.416
3.38%
jan 1, 1973
80.868
+6.881
9.3%
jan 1, 1974
84.699
+3.832
4.74%
jan 1, 1975
81.766
-2.933
-3.46%
jan 1, 1976
79.221
-2.545
-3.11%
jan 1, 1977
82.814
+3.594
4.54%
jan 1, 1978
82.789
-0.025
-0.03%
jan 1, 1979
83.238
+0.448
0.54%
jan 1, 1980
81.913
-1.325
-1.59%
jan 1, 1981
79.794
-2.119
-2.59%
jan 1, 1982
77.064
-2.73
-3.42%
jan 1, 1983
75.261
-1.803
-2.34%
jan 1, 1984
76.684
+1.423
1.89%
jan 1, 1985
78.259
+1.576
2.05%
jan 1, 1986
80.848
+2.589
3.31%
jan 1, 1987
80.498
-0.35
-0.43%
jan 1, 1988
79.906
-0.592
-0.74%
jan 1, 1989
79.689
-0.218
-0.27%
jan 1, 1990
80.116
+0.427
0.54%
jan 1, 1991
78.964
-1.152
-1.44%
jan 1, 1992
79.818
+0.853
1.08%
jan 1, 1993
81.259
+1.442
1.81%
jan 1, 1994
80.744
-0.515
-0.63%
jan 1, 1995
80.315
-0.429
-0.53%
jan 1, 1996
81.644
+1.328
1.65%
jan 1, 1997
81.815
+0.171
0.21%
jan 1, 1998
81.959
+0.144
0.18%
jan 1, 1999
81.724
-0.235
-0.29%
jan 1, 2000
81.982
+0.258
0.32%
jan 1, 2001
81.479
-0.504
-0.61%
jan 1, 2002
79.963
-1.515
-1.86%
jan 1, 2003
79.706
-0.257
-0.32%
jan 1, 2004
80.783
+1.077
1.35%
jan 1, 2005
79.989
-0.794
-0.98%
jan 1, 2006
80.482
+0.493
0.62%
jan 1, 2007
80.283
-0.198
-0.25%
jan 1, 2008
79.443
-0.841
-1.05%
jan 1, 2009
79.353
-0.09
-0.11%
Ranking of countries by current statistics by years


Comments: