29
/
en
AIzaSyAYiBZKx7MnpbEhh9jyipgxe19OcubqV5w
April 1, 2024
34178
Fragile and conflict affected situations
FCS
false
2
1
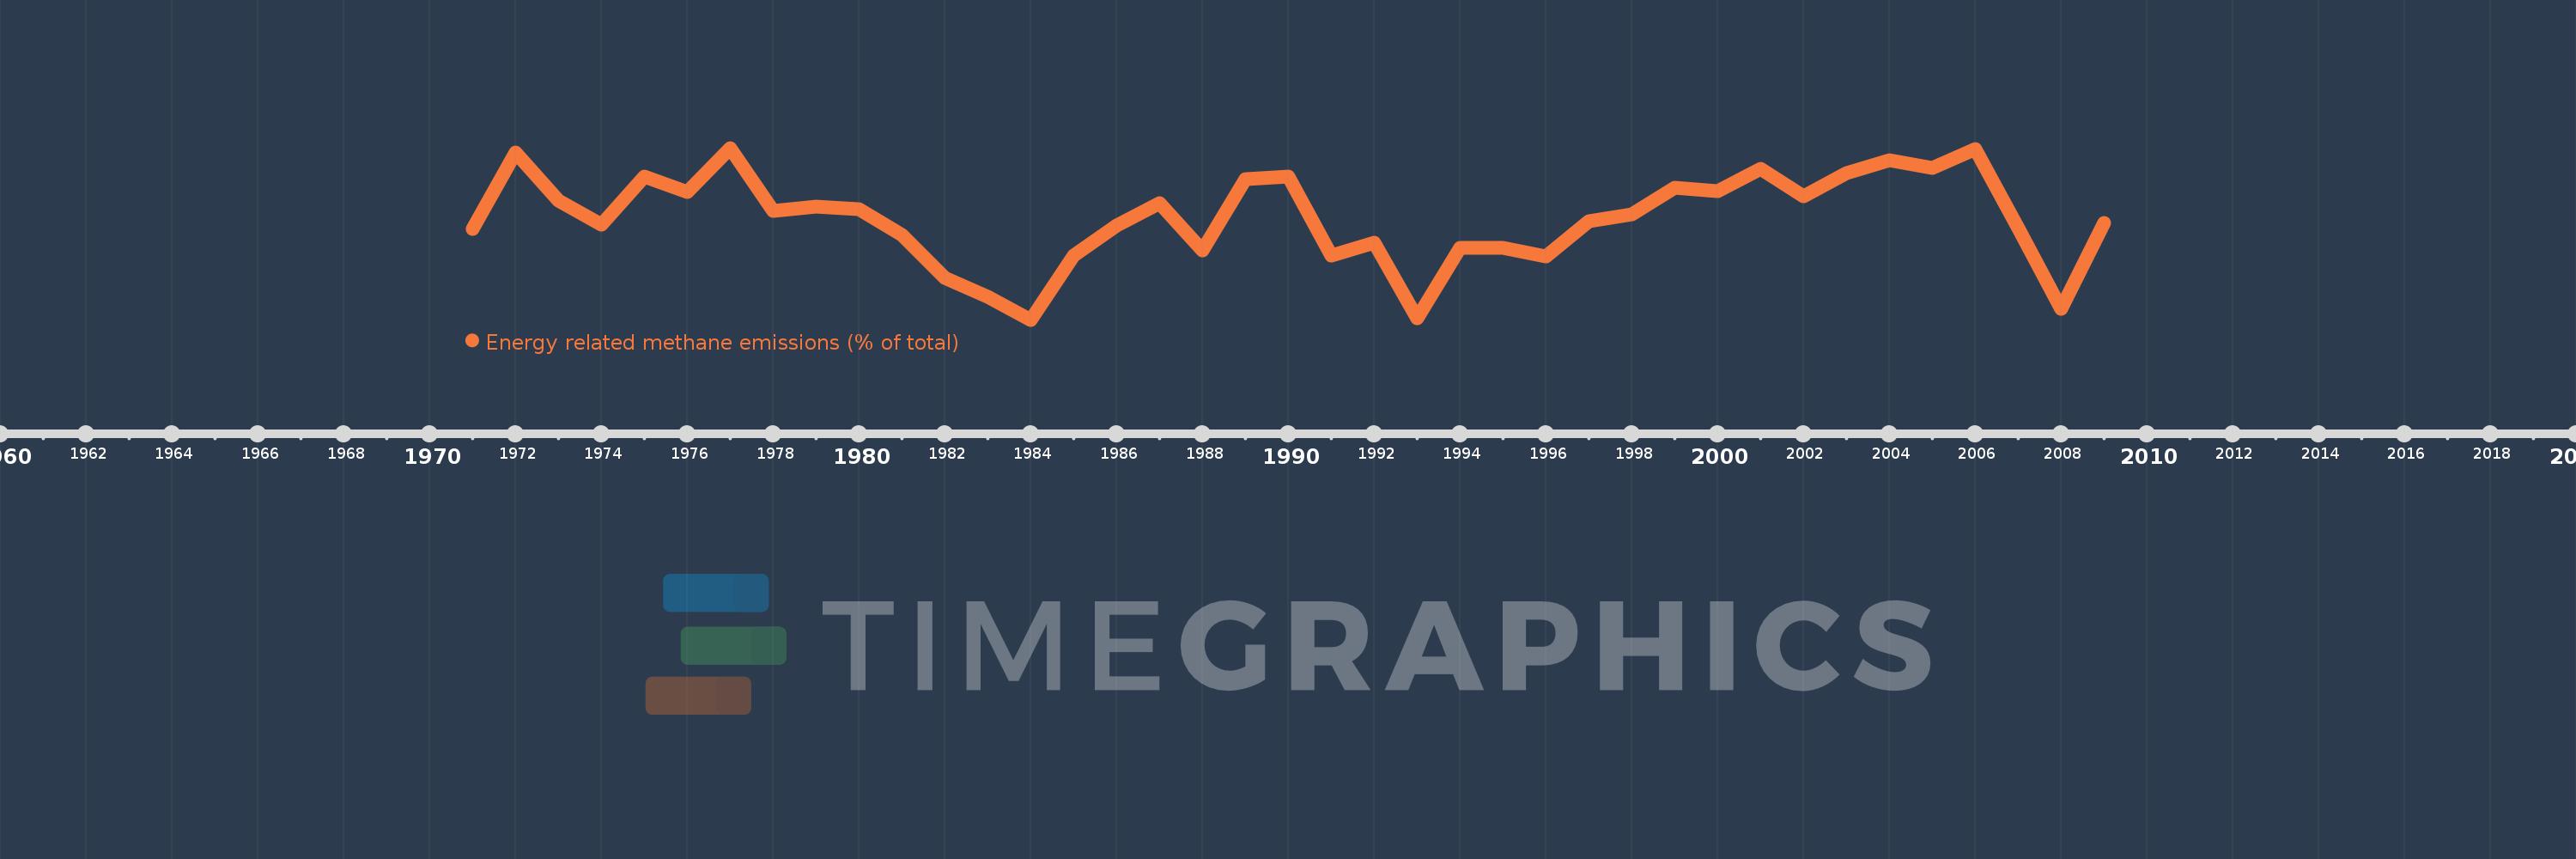
Energy related methane emissions (% of total)
2009,2008,2007,2006,2005,2004,2003,2002,2001,2000,1999,1998,1997,1996,1995,1994,1993,1992,1991,1990,1989,1988,1987,1986,1985,1984,1983,1982,1981,1980,1979,1978,1977,1976,1975,1974,1973,1972,1971
This statistics in other country:
AfghanistanAlbaniaAlgeriaAmerican SamoaAngolaAntigua and BarbudaArab WorldArgentinaArmeniaArubaAustraliaAustriaAzerbaijanBahamas, TheBahrainBangladeshBarbadosBelarusBelgiumBelizeBeninBermudaBhutanBoliviaBosnia and HerzegovinaBotswanaBrazilBritish Virgin IslandsBrunei DarussalamBulgariaBurkina FasoBurundiCabo VerdeCambodiaCameroonCanadaCaribbean small statesCayman IslandsCentral African RepublicCentral Europe and the BalticsChadChileChinaColombiaComorosCongo, Dem. Rep.Congo, Rep.Costa RicaCote d'IvoireCroatiaCubaCyprusCzech RepublicDenmarkDjiboutiDominicaDominican RepublicEarly-demographic dividendEast Asia & PacificEast Asia & Pacific (excluding high income)East Asia & Pacific (IDA & IBRD countries)EcuadorEgypt, Arab Rep.El SalvadorEquatorial GuineaEritreaEstoniaEthiopiaEuro areaEurope & Central AsiaEurope & Central Asia (excluding high income)Europe & Central Asia (IDA & IBRD countries)European UnionFaroe IslandsFijiFinlandFragile and conflict affected situationsFranceFrench PolynesiaGabonGambia, TheGeorgiaGermanyGhanaGibraltarGreeceGreenlandGrenadaGuamGuatemalaGuineaGuinea-BissauGuyanaHaitiHeavily indebted poor countries (HIPC)High incomeHondurasHong Kong SAR, ChinaHungaryIBRD onlyIcelandIDA & IBRD totalIDA blendIDA onlyIDA totalIndiaIndonesiaIran, Islamic Rep.IraqIrelandIsraelItalyJamaicaJapanJordanKazakhstanKenyaKiribatiKorea, Dem. People’s Rep.Korea, Rep.KuwaitKyrgyz RepublicLao PDRLate-demographic dividendLatin America & Caribbean Latin America & Caribbean (excluding high income)Latin America & the Caribbean (IDA & IBRD countries)LatviaLeast developed countries: UN classificationLebanonLesothoLiberiaLibyaLithuaniaLow & middle incomeLow incomeLower middle incomeLuxembourgMacao SAR, ChinaMacedonia, FYRMadagascarMalawiMalaysiaMaldivesMaliMaltaMarshall IslandsMauritaniaMauritiusMexicoMicronesia, Fed. Sts.Middle East & North AfricaMiddle East & North Africa (excluding high income)Middle East & North Africa (IDA & IBRD countries)Middle incomeMoldovaMongoliaMoroccoMozambiqueMyanmarNamibiaNauruNepalNetherlandsNew CaledoniaNew ZealandNicaraguaNigerNigeriaNorth AmericaNorthern Mariana IslandsNorwayOECD membersOmanOther small statesPacific island small statesPakistanPalauPanamaPapua New GuineaParaguayPeruPhilippinesPolandPortugalPost-demographic dividendPre-demographic dividendPuerto RicoQatarRomaniaRussian FederationRwandaSamoaSao Tome and PrincipeSaudi ArabiaSenegalSerbiaSeychellesSierra LeoneSingaporeSlovak RepublicSloveniaSmall statesSolomon IslandsSomaliaSouth AfricaSouth AsiaSouth Asia (IDA & IBRD)SpainSri LankaSt. Kitts and NevisSt. LuciaSt. Vincent and the GrenadinesSub-Saharan Africa Sub-Saharan Africa (excluding high income)Sub-Saharan Africa (IDA & IBRD countries)SudanSurinameSwazilandSwedenSwitzerlandSyrian Arab RepublicTajikistanTanzaniaThailandTimor-LesteTogoTongaTrinidad and TobagoTunisiaTurkeyTurkmenistanTurks and Caicos IslandsTuvaluUgandaUkraineUnited Arab EmiratesUnited KingdomUnited StatesUpper middle incomeUruguayUzbekistanVanuatuVenezuela, RBVietnamVirgin Islands (U.S.)WorldYemen, Rep.ZambiaZimbabwe Timeline:
This timeline shows a graph from 1971 to 2009 of Fragile and conflict affected situations. No data until 1970. Number of actual observations by date: 39.
Source name:
World Development Indicators
Source organization:
World Bank staff estimates from original source: European Commission, Joint Research Centre (JRC)/Netherlands Environmental Assessment Agency (PBL). Emission Database for Global Atmospheric Research (EDGAR): http://edgar.jrc.ec.europa.eu/.
Categories, topics:
Energy & Mining, Environment
Last updated:
apr 23, 2017
Indicators value changes by year
Minimum:
10.795
jan 1, 1984
At the date of observation
Value
Absolute change
Change from previous value
jan 1, 1971
15.379
+15.379
0.0%
jan 1, 1972
19.243
+3.864
25.12%
jan 1, 1973
16.814
-2.428
-12.62%
jan 1, 1974
15.609
-1.205
-7.17%
jan 1, 1975
18.049
+2.44
15.63%
jan 1, 1976
17.241
-0.808
-4.48%
jan 1, 1977
19.48
+2.239
12.99%
jan 1, 1978
16.309
-3.172
-16.28%
jan 1, 1979
16.502
+0.194
1.19%
jan 1, 1980
16.386
-0.117
-0.71%
jan 1, 1981
15.066
-1.319
-8.05%
jan 1, 1982
12.929
-2.138
-14.19%
jan 1, 1983
11.966
-0.963
-7.45%
jan 1, 1984
10.795
-1.171
-9.79%
jan 1, 1985
14.021
+3.226
29.89%
jan 1, 1986
15.541
+1.52
10.84%
jan 1, 1987
16.692
+1.151
7.41%
jan 1, 1988
14.302
-2.39
-14.32%
jan 1, 1989
17.922
+3.619
25.31%
jan 1, 1990
18.032
+0.11
0.62%
jan 1, 1991
14.036
-3.996
-22.16%
jan 1, 1992
14.68
+0.644
4.59%
jan 1, 1993
10.853
-3.826
-26.06%
jan 1, 1994
14.428
+3.574
32.93%
jan 1, 1995
14.415
-0.012
-0.08%
jan 1, 1996
14.017
-0.399
-2.77%
jan 1, 1997
15.777
+1.761
12.56%
jan 1, 1998
16.107
+0.33
2.09%
jan 1, 1999
17.479
+1.372
8.52%
jan 1, 2000
17.311
-0.168
-0.96%
jan 1, 2001
18.443
+1.132
6.54%
jan 1, 2002
17.055
-1.389
-7.53%
jan 1, 2003
18.192
+1.137
6.67%
jan 1, 2004
18.87
+0.678
3.73%
jan 1, 2005
18.447
-0.423
-2.24%
jan 1, 2006
19.411
+0.964
5.23%
jan 1, 2007
15.443
-3.968
-20.44%
jan 1, 2008
11.338
-4.106
-26.58%
jan 1, 2009
15.668
+4.33
38.19%
Ranking of countries by current statistics by years


Comments: