29
/
en
AIzaSyAYiBZKx7MnpbEhh9jyipgxe19OcubqV5w
April 1, 2024
228389
Romania
ROU
true
2
1
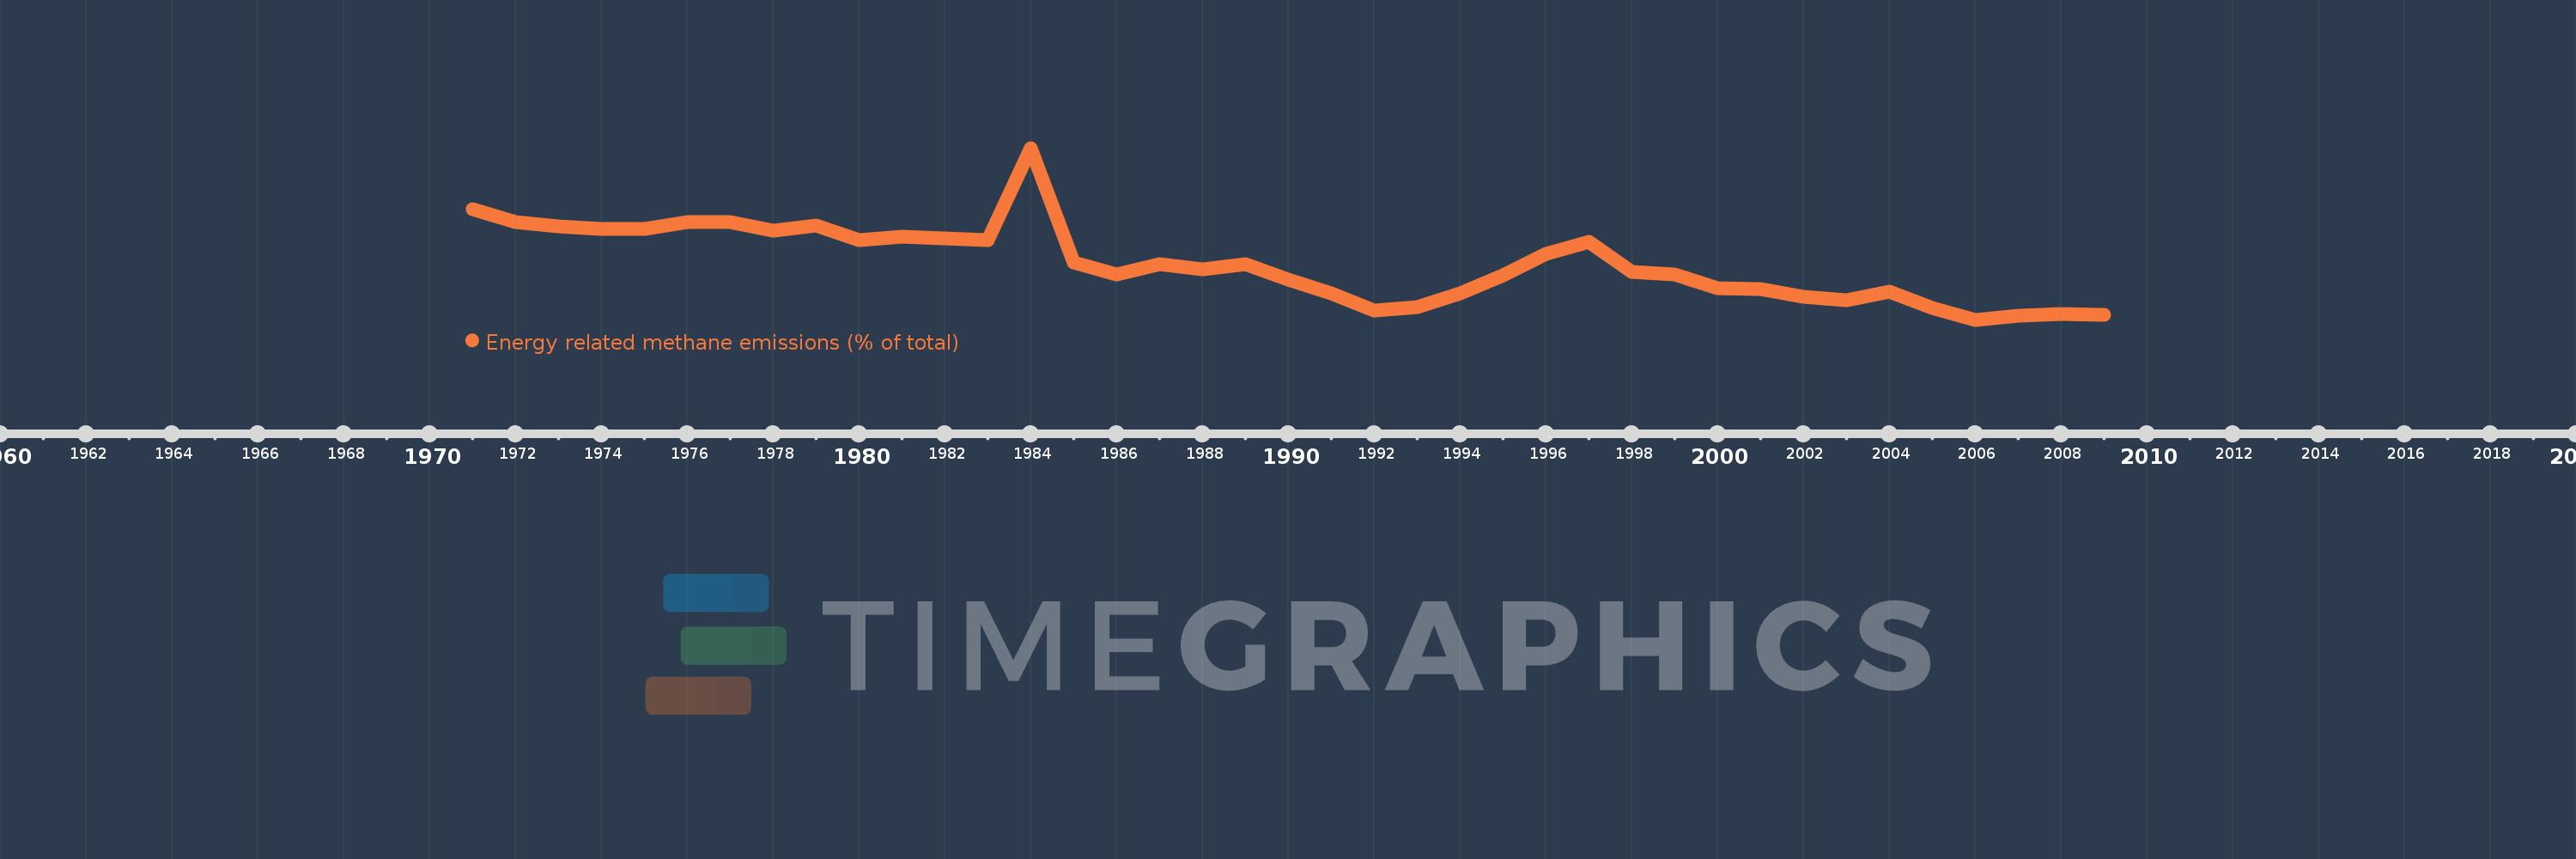
Energy related methane emissions (% of total)
2009,2008,2007,2006,2005,2004,2003,2002,2001,2000,1999,1998,1997,1996,1995,1994,1993,1992,1991,1990,1989,1988,1987,1986,1985,1984,1983,1982,1981,1980,1979,1978,1977,1976,1975,1974,1973,1972,1971
This statistics in other country:
AfghanistanAlbaniaAlgeriaAmerican SamoaAngolaAntigua and BarbudaArab WorldArgentinaArmeniaArubaAustraliaAustriaAzerbaijanBahamas, TheBahrainBangladeshBarbadosBelarusBelgiumBelizeBeninBermudaBhutanBoliviaBosnia and HerzegovinaBotswanaBrazilBritish Virgin IslandsBrunei DarussalamBulgariaBurkina FasoBurundiCabo VerdeCambodiaCameroonCanadaCaribbean small statesCayman IslandsCentral African RepublicCentral Europe and the BalticsChadChileChinaColombiaComorosCongo, Dem. Rep.Congo, Rep.Costa RicaCote d'IvoireCroatiaCubaCyprusCzech RepublicDenmarkDjiboutiDominicaDominican RepublicEarly-demographic dividendEast Asia & PacificEast Asia & Pacific (excluding high income)East Asia & Pacific (IDA & IBRD countries)EcuadorEgypt, Arab Rep.El SalvadorEquatorial GuineaEritreaEstoniaEthiopiaEuro areaEurope & Central AsiaEurope & Central Asia (excluding high income)Europe & Central Asia (IDA & IBRD countries)European UnionFaroe IslandsFijiFinlandFragile and conflict affected situationsFranceFrench PolynesiaGabonGambia, TheGeorgiaGermanyGhanaGibraltarGreeceGreenlandGrenadaGuamGuatemalaGuineaGuinea-BissauGuyanaHaitiHeavily indebted poor countries (HIPC)High incomeHondurasHong Kong SAR, ChinaHungaryIBRD onlyIcelandIDA & IBRD totalIDA blendIDA onlyIDA totalIndiaIndonesiaIran, Islamic Rep.IraqIrelandIsraelItalyJamaicaJapanJordanKazakhstanKenyaKiribatiKorea, Dem. People’s Rep.Korea, Rep.KuwaitKyrgyz RepublicLao PDRLate-demographic dividendLatin America & Caribbean Latin America & Caribbean (excluding high income)Latin America & the Caribbean (IDA & IBRD countries)LatviaLeast developed countries: UN classificationLebanonLesothoLiberiaLibyaLithuaniaLow & middle incomeLow incomeLower middle incomeLuxembourgMacao SAR, ChinaMacedonia, FYRMadagascarMalawiMalaysiaMaldivesMaliMaltaMarshall IslandsMauritaniaMauritiusMexicoMicronesia, Fed. Sts.Middle East & North AfricaMiddle East & North Africa (excluding high income)Middle East & North Africa (IDA & IBRD countries)Middle incomeMoldovaMongoliaMoroccoMozambiqueMyanmarNamibiaNauruNepalNetherlandsNew CaledoniaNew ZealandNicaraguaNigerNigeriaNorth AmericaNorthern Mariana IslandsNorwayOECD membersOmanOther small statesPacific island small statesPakistanPalauPanamaPapua New GuineaParaguayPeruPhilippinesPolandPortugalPost-demographic dividendPre-demographic dividendPuerto RicoQatarRomaniaRussian FederationRwandaSamoaSao Tome and PrincipeSaudi ArabiaSenegalSerbiaSeychellesSierra LeoneSingaporeSlovak RepublicSloveniaSmall statesSolomon IslandsSomaliaSouth AfricaSouth AsiaSouth Asia (IDA & IBRD)SpainSri LankaSt. Kitts and NevisSt. LuciaSt. Vincent and the GrenadinesSub-Saharan Africa Sub-Saharan Africa (excluding high income)Sub-Saharan Africa (IDA & IBRD countries)SudanSurinameSwazilandSwedenSwitzerlandSyrian Arab RepublicTajikistanTanzaniaThailandTimor-LesteTogoTongaTrinidad and TobagoTunisiaTurkeyTurkmenistanTurks and Caicos IslandsTuvaluUgandaUkraineUnited Arab EmiratesUnited KingdomUnited StatesUpper middle incomeUruguayUzbekistanVanuatuVenezuela, RBVietnamVirgin Islands (U.S.)WorldYemen, Rep.ZambiaZimbabwe Timeline:
This timeline shows a graph from 1971 to 2009 of Romania. No data until 1970. Number of actual observations by date: 39.
Source name:
World Development Indicators
Source organization:
World Bank staff estimates from original source: European Commission, Joint Research Centre (JRC)/Netherlands Environmental Assessment Agency (PBL). Emission Database for Global Atmospheric Research (EDGAR): http://edgar.jrc.ec.europa.eu/.
Categories, topics:
Energy & Mining, Environment
Last updated:
apr 23, 2017
Indicators value changes by year
Minimum:
46.062
jan 1, 2006
Maximum:
60.556
jan 1, 1984
At the date of observation
Value
Absolute change
Change from previous value
jan 1, 1971
55.381
+55.381
0.0%
jan 1, 1972
54.331
-1.05
-1.9%
jan 1, 1973
53.941
-0.391
-0.72%
jan 1, 1974
53.726
-0.214
-0.4%
jan 1, 1975
53.751
+0.024
0.05%
jan 1, 1976
54.33
+0.579
1.08%
jan 1, 1977
54.325
-0.005
-0.01%
jan 1, 1978
53.6
-0.725
-1.34%
jan 1, 1979
54.024
+0.424
0.79%
jan 1, 1980
52.795
-1.229
-2.28%
jan 1, 1981
53.035
+0.241
0.46%
jan 1, 1982
52.918
-0.117
-0.22%
jan 1, 1983
52.752
-0.166
-0.31%
jan 1, 1984
60.556
+7.804
14.79%
jan 1, 1985
50.885
-9.671
-15.97%
jan 1, 1986
49.911
-0.974
-1.91%
jan 1, 1987
50.752
+0.841
1.69%
jan 1, 1988
50.346
-0.407
-0.8%
jan 1, 1989
50.732
+0.386
0.77%
jan 1, 1990
49.466
-1.266
-2.49%
jan 1, 1991
48.297
-1.169
-2.36%
jan 1, 1992
46.827
-1.47
-3.04%
jan 1, 1993
47.142
+0.314
0.67%
jan 1, 1994
48.285
+1.143
2.42%
jan 1, 1995
49.799
+1.515
3.14%
jan 1, 1996
51.589
+1.789
3.59%
jan 1, 1997
52.601
+1.012
1.96%
jan 1, 1998
50.089
-2.512
-4.77%
jan 1, 1999
49.884
-0.205
-0.41%
jan 1, 2000
48.748
-1.136
-2.28%
jan 1, 2001
48.651
-0.097
-0.2%
jan 1, 2002
48.01
-0.641
-1.32%
jan 1, 2003
47.698
-0.312
-0.65%
jan 1, 2004
48.459
+0.761
1.6%
jan 1, 2005
47.082
-1.378
-2.84%
jan 1, 2006
46.062
-1.02
-2.17%
jan 1, 2007
46.436
+0.374
0.81%
jan 1, 2008
46.569
+0.132
0.29%
jan 1, 2009
46.47
-0.098
-0.21%
Ranking of countries by current statistics by years


Comments: