29
/
en
AIzaSyAYiBZKx7MnpbEhh9jyipgxe19OcubqV5w
April 1, 2024
242516
Slovenia
SVN
true
2
1
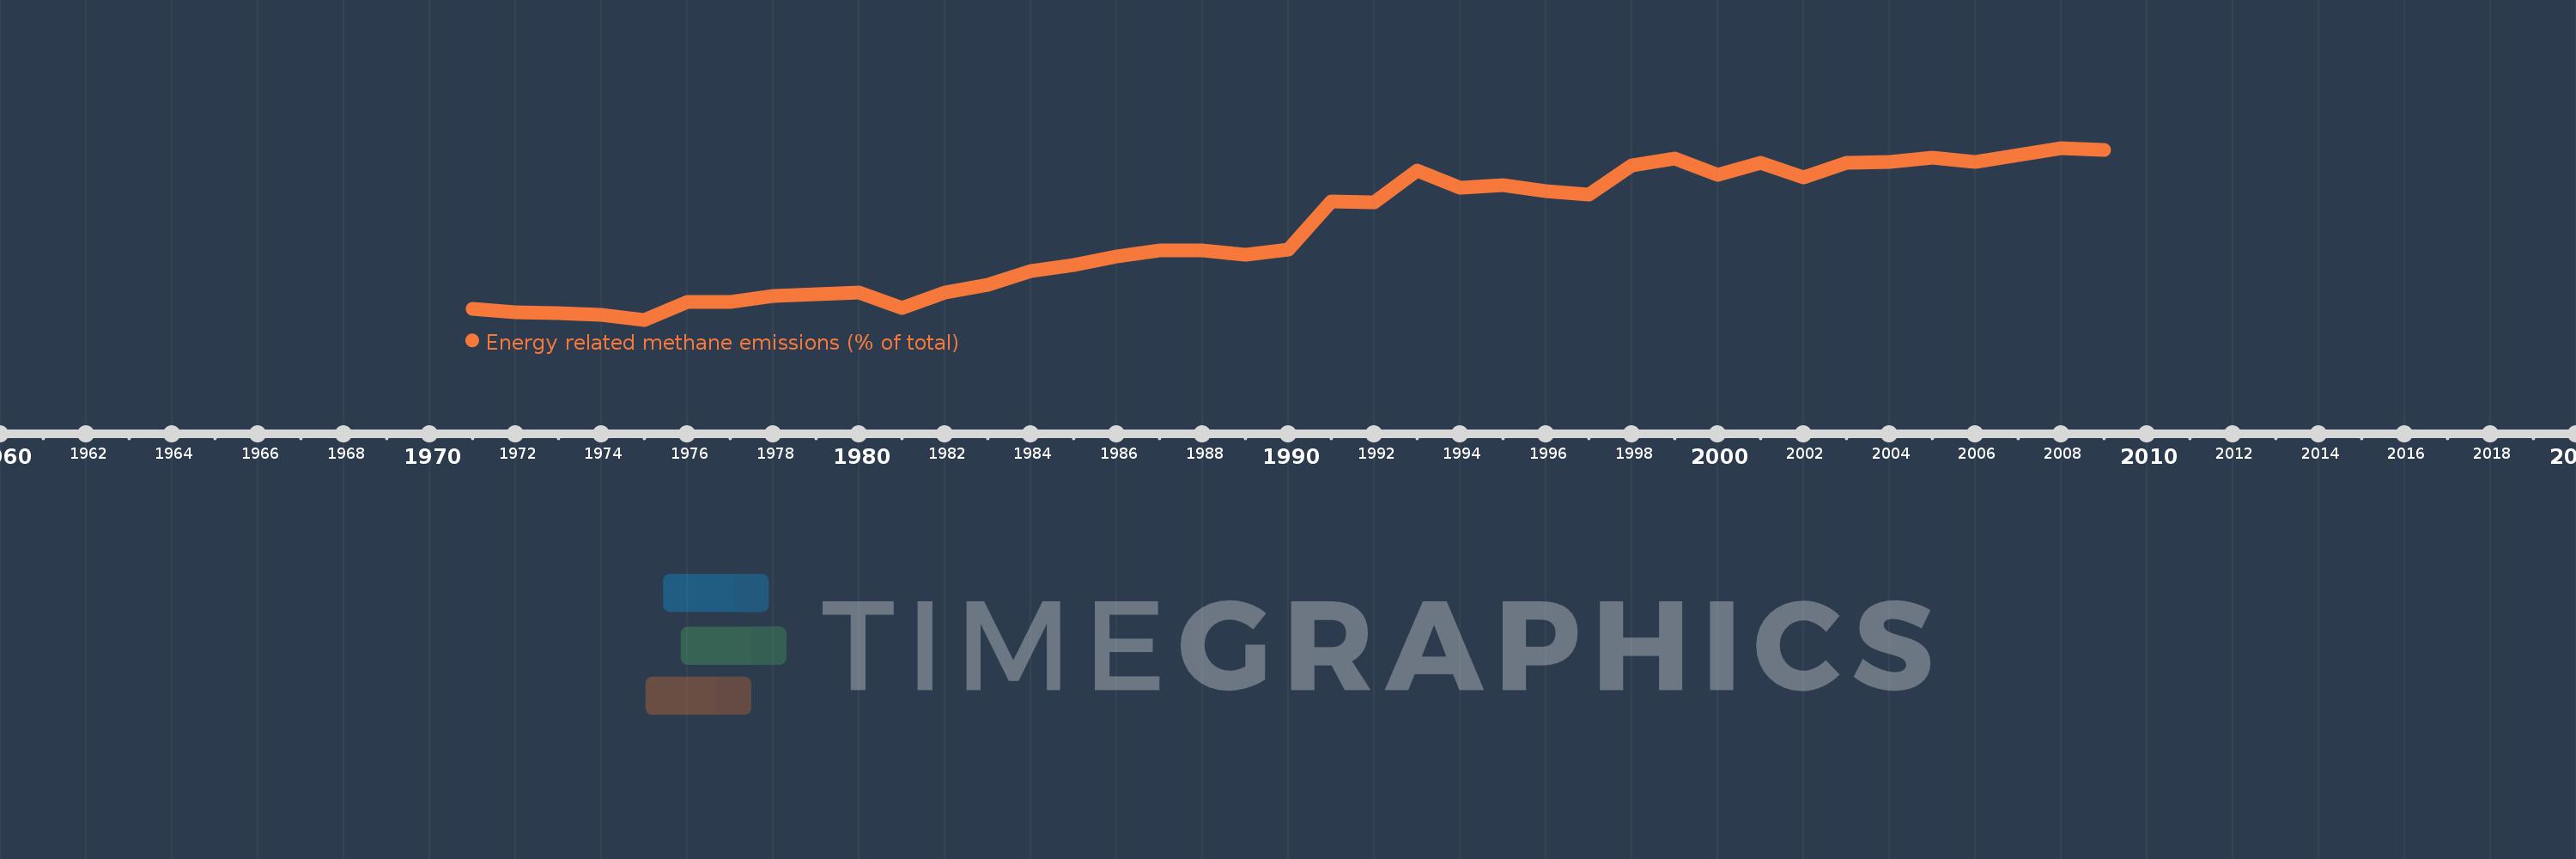
Energy related methane emissions (% of total)
2009,2008,2007,2006,2005,2004,2003,2002,2001,2000,1999,1998,1997,1996,1995,1994,1993,1992,1991,1990,1989,1988,1987,1986,1985,1984,1983,1982,1981,1980,1979,1978,1977,1976,1975,1974,1973,1972,1971
This statistics in other country:
AfghanistanAlbaniaAlgeriaAmerican SamoaAngolaAntigua and BarbudaArab WorldArgentinaArmeniaArubaAustraliaAustriaAzerbaijanBahamas, TheBahrainBangladeshBarbadosBelarusBelgiumBelizeBeninBermudaBhutanBoliviaBosnia and HerzegovinaBotswanaBrazilBritish Virgin IslandsBrunei DarussalamBulgariaBurkina FasoBurundiCabo VerdeCambodiaCameroonCanadaCaribbean small statesCayman IslandsCentral African RepublicCentral Europe and the BalticsChadChileChinaColombiaComorosCongo, Dem. Rep.Congo, Rep.Costa RicaCote d'IvoireCroatiaCubaCyprusCzech RepublicDenmarkDjiboutiDominicaDominican RepublicEarly-demographic dividendEast Asia & PacificEast Asia & Pacific (excluding high income)East Asia & Pacific (IDA & IBRD countries)EcuadorEgypt, Arab Rep.El SalvadorEquatorial GuineaEritreaEstoniaEthiopiaEuro areaEurope & Central AsiaEurope & Central Asia (excluding high income)Europe & Central Asia (IDA & IBRD countries)European UnionFaroe IslandsFijiFinlandFragile and conflict affected situationsFranceFrench PolynesiaGabonGambia, TheGeorgiaGermanyGhanaGibraltarGreeceGreenlandGrenadaGuamGuatemalaGuineaGuinea-BissauGuyanaHaitiHeavily indebted poor countries (HIPC)High incomeHondurasHong Kong SAR, ChinaHungaryIBRD onlyIcelandIDA & IBRD totalIDA blendIDA onlyIDA totalIndiaIndonesiaIran, Islamic Rep.IraqIrelandIsraelItalyJamaicaJapanJordanKazakhstanKenyaKiribatiKorea, Dem. People’s Rep.Korea, Rep.KuwaitKyrgyz RepublicLao PDRLate-demographic dividendLatin America & Caribbean Latin America & Caribbean (excluding high income)Latin America & the Caribbean (IDA & IBRD countries)LatviaLeast developed countries: UN classificationLebanonLesothoLiberiaLibyaLithuaniaLow & middle incomeLow incomeLower middle incomeLuxembourgMacao SAR, ChinaMacedonia, FYRMadagascarMalawiMalaysiaMaldivesMaliMaltaMarshall IslandsMauritaniaMauritiusMexicoMicronesia, Fed. Sts.Middle East & North AfricaMiddle East & North Africa (excluding high income)Middle East & North Africa (IDA & IBRD countries)Middle incomeMoldovaMongoliaMoroccoMozambiqueMyanmarNamibiaNauruNepalNetherlandsNew CaledoniaNew ZealandNicaraguaNigerNigeriaNorth AmericaNorthern Mariana IslandsNorwayOECD membersOmanOther small statesPacific island small statesPakistanPalauPanamaPapua New GuineaParaguayPeruPhilippinesPolandPortugalPost-demographic dividendPre-demographic dividendPuerto RicoQatarRomaniaRussian FederationRwandaSamoaSao Tome and PrincipeSaudi ArabiaSenegalSerbiaSeychellesSierra LeoneSingaporeSlovak RepublicSloveniaSmall statesSolomon IslandsSomaliaSouth AfricaSouth AsiaSouth Asia (IDA & IBRD)SpainSri LankaSt. Kitts and NevisSt. LuciaSt. Vincent and the GrenadinesSub-Saharan Africa Sub-Saharan Africa (excluding high income)Sub-Saharan Africa (IDA & IBRD countries)SudanSurinameSwazilandSwedenSwitzerlandSyrian Arab RepublicTajikistanTanzaniaThailandTimor-LesteTogoTongaTrinidad and TobagoTunisiaTurkeyTurkmenistanTurks and Caicos IslandsTuvaluUgandaUkraineUnited Arab EmiratesUnited KingdomUnited StatesUpper middle incomeUruguayUzbekistanVanuatuVenezuela, RBVietnamVirgin Islands (U.S.)WorldYemen, Rep.ZambiaZimbabwe Timeline:
This timeline shows a graph from 1971 to 2009 of Slovenia. No data until 1970. Number of actual observations by date: 39.
Source name:
World Development Indicators
Source organization:
World Bank staff estimates from original source: European Commission, Joint Research Centre (JRC)/Netherlands Environmental Assessment Agency (PBL). Emission Database for Global Atmospheric Research (EDGAR): http://edgar.jrc.ec.europa.eu/.
Categories, topics:
Energy & Mining, Environment
Last updated:
apr 23, 2017
Indicators value changes by year
Minimum:
18.974
jan 1, 1975
Maximum:
39.078
jan 1, 2008
At the date of observation
Value
Absolute change
Change from previous value
jan 1, 1971
20.291
+20.291
0.0%
jan 1, 1972
19.821
-0.471
-2.32%
jan 1, 1973
19.717
-0.104
-0.52%
jan 1, 1974
19.571
-0.145
-0.74%
jan 1, 1975
18.974
-0.597
-3.05%
jan 1, 1976
21.068
+2.094
11.04%
jan 1, 1977
21.032
-0.036
-0.17%
jan 1, 1978
21.718
+0.686
3.26%
jan 1, 1979
21.923
+0.205
0.94%
jan 1, 1980
22.148
+0.224
1.02%
jan 1, 1981
20.33
-1.817
-8.21%
jan 1, 1982
22.155
+1.825
8.98%
jan 1, 1983
23.024
+0.869
3.92%
jan 1, 1984
24.629
+1.605
6.97%
jan 1, 1985
25.369
+0.74
3.01%
jan 1, 1986
26.366
+0.997
3.93%
jan 1, 1987
27.132
+0.766
2.91%
jan 1, 1988
27.077
-0.055
-0.2%
jan 1, 1989
26.55
-0.527
-1.94%
jan 1, 1990
27.188
+0.638
2.4%
jan 1, 1991
32.841
+5.653
20.79%
jan 1, 1992
32.689
-0.152
-0.46%
jan 1, 1993
36.444
+3.755
11.49%
jan 1, 1994
34.385
-2.059
-5.65%
jan 1, 1995
34.691
+0.305
0.89%
jan 1, 1996
34.013
-0.678
-1.95%
jan 1, 1997
33.621
-0.392
-1.15%
jan 1, 1998
37.039
+3.418
10.17%
jan 1, 1999
37.832
+0.793
2.14%
jan 1, 2000
35.976
-1.856
-4.91%
jan 1, 2001
37.311
+1.335
3.71%
jan 1, 2002
35.596
-1.715
-4.6%
jan 1, 2003
37.339
+1.743
4.9%
jan 1, 2004
37.42
+0.081
0.22%
jan 1, 2005
37.943
+0.524
1.4%
jan 1, 2006
37.409
-0.534
-1.41%
jan 1, 2007
38.249
+0.84
2.25%
jan 1, 2008
39.078
+0.828
2.17%
jan 1, 2009
38.853
-0.225
-0.57%
Ranking of countries by current statistics by years


Comments: