29
/
en
AIzaSyAYiBZKx7MnpbEhh9jyipgxe19OcubqV5w
April 1, 2024
47061
Lower middle income
LMC
false
2
1
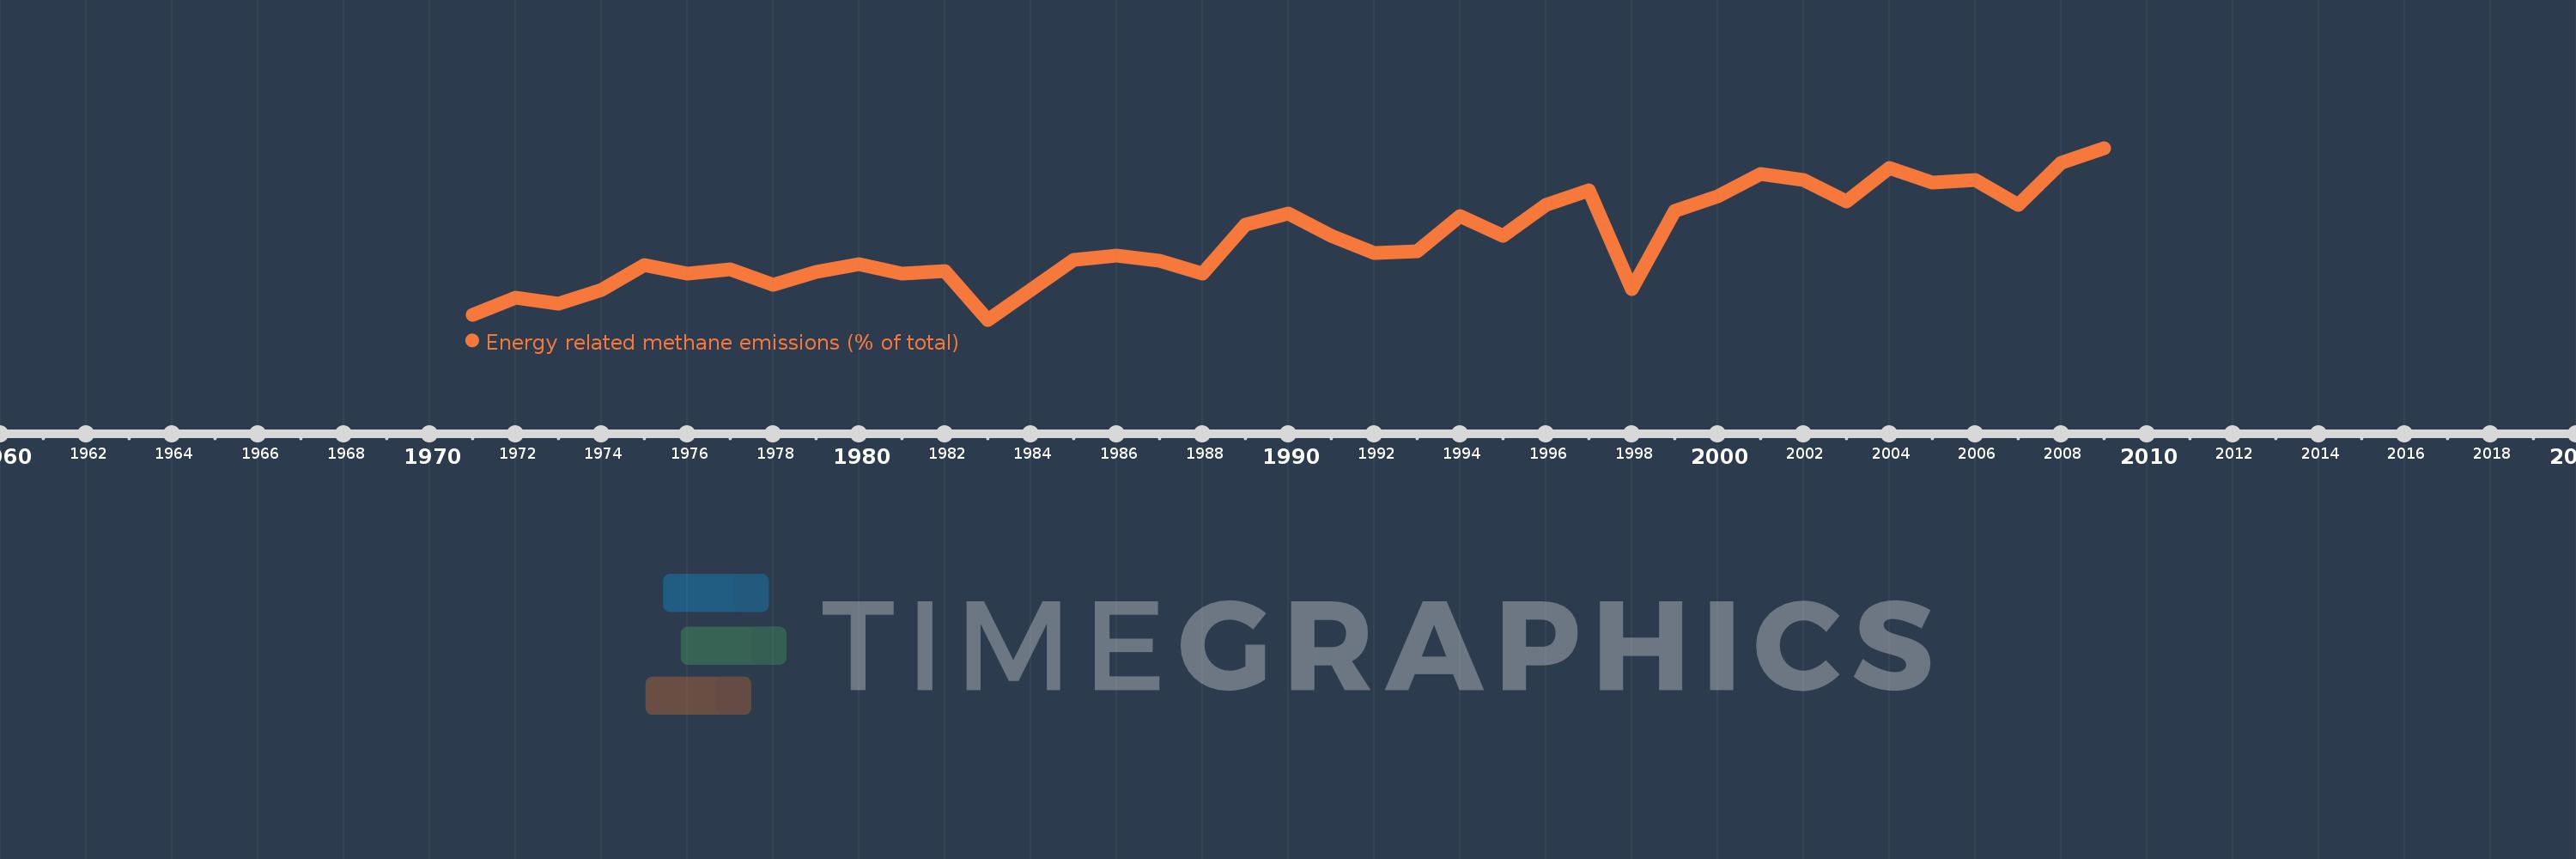
Energy related methane emissions (% of total)
2009,2008,2007,2006,2005,2004,2003,2002,2001,2000,1999,1998,1997,1996,1995,1994,1993,1992,1991,1990,1989,1988,1987,1986,1985,1984,1983,1982,1981,1980,1979,1978,1977,1976,1975,1974,1973,1972,1971
This statistics in other country:
AfghanistanAlbaniaAlgeriaAmerican SamoaAngolaAntigua and BarbudaArab WorldArgentinaArmeniaArubaAustraliaAustriaAzerbaijanBahamas, TheBahrainBangladeshBarbadosBelarusBelgiumBelizeBeninBermudaBhutanBoliviaBosnia and HerzegovinaBotswanaBrazilBritish Virgin IslandsBrunei DarussalamBulgariaBurkina FasoBurundiCabo VerdeCambodiaCameroonCanadaCaribbean small statesCayman IslandsCentral African RepublicCentral Europe and the BalticsChadChileChinaColombiaComorosCongo, Dem. Rep.Congo, Rep.Costa RicaCote d'IvoireCroatiaCubaCyprusCzech RepublicDenmarkDjiboutiDominicaDominican RepublicEarly-demographic dividendEast Asia & PacificEast Asia & Pacific (excluding high income)East Asia & Pacific (IDA & IBRD countries)EcuadorEgypt, Arab Rep.El SalvadorEquatorial GuineaEritreaEstoniaEthiopiaEuro areaEurope & Central AsiaEurope & Central Asia (excluding high income)Europe & Central Asia (IDA & IBRD countries)European UnionFaroe IslandsFijiFinlandFragile and conflict affected situationsFranceFrench PolynesiaGabonGambia, TheGeorgiaGermanyGhanaGibraltarGreeceGreenlandGrenadaGuamGuatemalaGuineaGuinea-BissauGuyanaHaitiHeavily indebted poor countries (HIPC)High incomeHondurasHong Kong SAR, ChinaHungaryIBRD onlyIcelandIDA & IBRD totalIDA blendIDA onlyIDA totalIndiaIndonesiaIran, Islamic Rep.IraqIrelandIsraelItalyJamaicaJapanJordanKazakhstanKenyaKiribatiKorea, Dem. People’s Rep.Korea, Rep.KuwaitKyrgyz RepublicLao PDRLate-demographic dividendLatin America & Caribbean Latin America & Caribbean (excluding high income)Latin America & the Caribbean (IDA & IBRD countries)LatviaLeast developed countries: UN classificationLebanonLesothoLiberiaLibyaLithuaniaLow & middle incomeLow incomeLower middle incomeLuxembourgMacao SAR, ChinaMacedonia, FYRMadagascarMalawiMalaysiaMaldivesMaliMaltaMarshall IslandsMauritaniaMauritiusMexicoMicronesia, Fed. Sts.Middle East & North AfricaMiddle East & North Africa (excluding high income)Middle East & North Africa (IDA & IBRD countries)Middle incomeMoldovaMongoliaMoroccoMozambiqueMyanmarNamibiaNauruNepalNetherlandsNew CaledoniaNew ZealandNicaraguaNigerNigeriaNorth AmericaNorthern Mariana IslandsNorwayOECD membersOmanOther small statesPacific island small statesPakistanPalauPanamaPapua New GuineaParaguayPeruPhilippinesPolandPortugalPost-demographic dividendPre-demographic dividendPuerto RicoQatarRomaniaRussian FederationRwandaSamoaSao Tome and PrincipeSaudi ArabiaSenegalSerbiaSeychellesSierra LeoneSingaporeSlovak RepublicSloveniaSmall statesSolomon IslandsSomaliaSouth AfricaSouth AsiaSouth Asia (IDA & IBRD)SpainSri LankaSt. Kitts and NevisSt. LuciaSt. Vincent and the GrenadinesSub-Saharan Africa Sub-Saharan Africa (excluding high income)Sub-Saharan Africa (IDA & IBRD countries)SudanSurinameSwazilandSwedenSwitzerlandSyrian Arab RepublicTajikistanTanzaniaThailandTimor-LesteTogoTongaTrinidad and TobagoTunisiaTurkeyTurkmenistanTurks and Caicos IslandsTuvaluUgandaUkraineUnited Arab EmiratesUnited KingdomUnited StatesUpper middle incomeUruguayUzbekistanVanuatuVenezuela, RBVietnamVirgin Islands (U.S.)WorldYemen, Rep.ZambiaZimbabwe Timeline:
This timeline shows a graph from 1971 to 2009 of Lower middle income. No data until 1970. Number of actual observations by date: 39.
Source name:
World Development Indicators
Source organization:
World Bank staff estimates from original source: European Commission, Joint Research Centre (JRC)/Netherlands Environmental Assessment Agency (PBL). Emission Database for Global Atmospheric Research (EDGAR): http://edgar.jrc.ec.europa.eu/.
Categories, topics:
Energy & Mining, Environment
Last updated:
apr 23, 2017
Indicators value changes by year
Minimum:
13.115
jan 1, 1983
Maximum:
24.358
jan 1, 2009
At the date of observation
Value
Absolute change
Change from previous value
jan 1, 1971
13.427
+13.427
0.0%
jan 1, 1972
14.586
+1.159
8.63%
jan 1, 1973
14.14
-0.447
-3.06%
jan 1, 1974
15.043
+0.903
6.39%
jan 1, 1975
16.686
+1.643
10.92%
jan 1, 1976
16.106
-0.58
-3.48%
jan 1, 1977
16.389
+0.283
1.76%
jan 1, 1978
15.423
-0.966
-5.89%
jan 1, 1979
16.236
+0.814
5.28%
jan 1, 1980
16.753
+0.517
3.18%
jan 1, 1981
16.142
-0.611
-3.65%
jan 1, 1982
16.283
+0.141
0.87%
jan 1, 1983
13.115
-3.168
-19.45%
jan 1, 1984
15.084
+1.97
15.02%
jan 1, 1985
17.016
+1.932
12.81%
jan 1, 1986
17.308
+0.292
1.71%
jan 1, 1987
16.959
-0.349
-2.01%
jan 1, 1988
16.122
-0.837
-4.94%
jan 1, 1989
19.339
+3.217
19.95%
jan 1, 1990
20.053
+0.714
3.69%
jan 1, 1991
18.607
-1.445
-7.21%
jan 1, 1992
17.486
-1.121
-6.03%
jan 1, 1993
17.569
+0.083
0.48%
jan 1, 1994
19.923
+2.354
13.4%
jan 1, 1995
18.586
-1.337
-6.71%
jan 1, 1996
20.607
+2.021
10.87%
jan 1, 1997
21.599
+0.992
4.81%
jan 1, 1998
15.115
-6.484
-30.02%
jan 1, 1999
20.23
+5.115
33.84%
jan 1, 2000
21.167
+0.937
4.63%
jan 1, 2001
22.653
+1.485
7.02%
jan 1, 2002
22.254
-0.399
-1.76%
jan 1, 2003
20.881
-1.373
-6.17%
jan 1, 2004
23.065
+2.184
10.46%
jan 1, 2005
22.096
-0.968
-4.2%
jan 1, 2006
22.263
+0.167
0.76%
jan 1, 2007
20.627
-1.636
-7.35%
jan 1, 2008
23.369
+2.742
13.29%
jan 1, 2009
24.358
+0.989
4.23%
Ranking of countries by current statistics by years


Comments: