29
/
en
AIzaSyAYiBZKx7MnpbEhh9jyipgxe19OcubqV5w
April 1, 2024
166056
Kazakhstan
KAZ
true
2
1
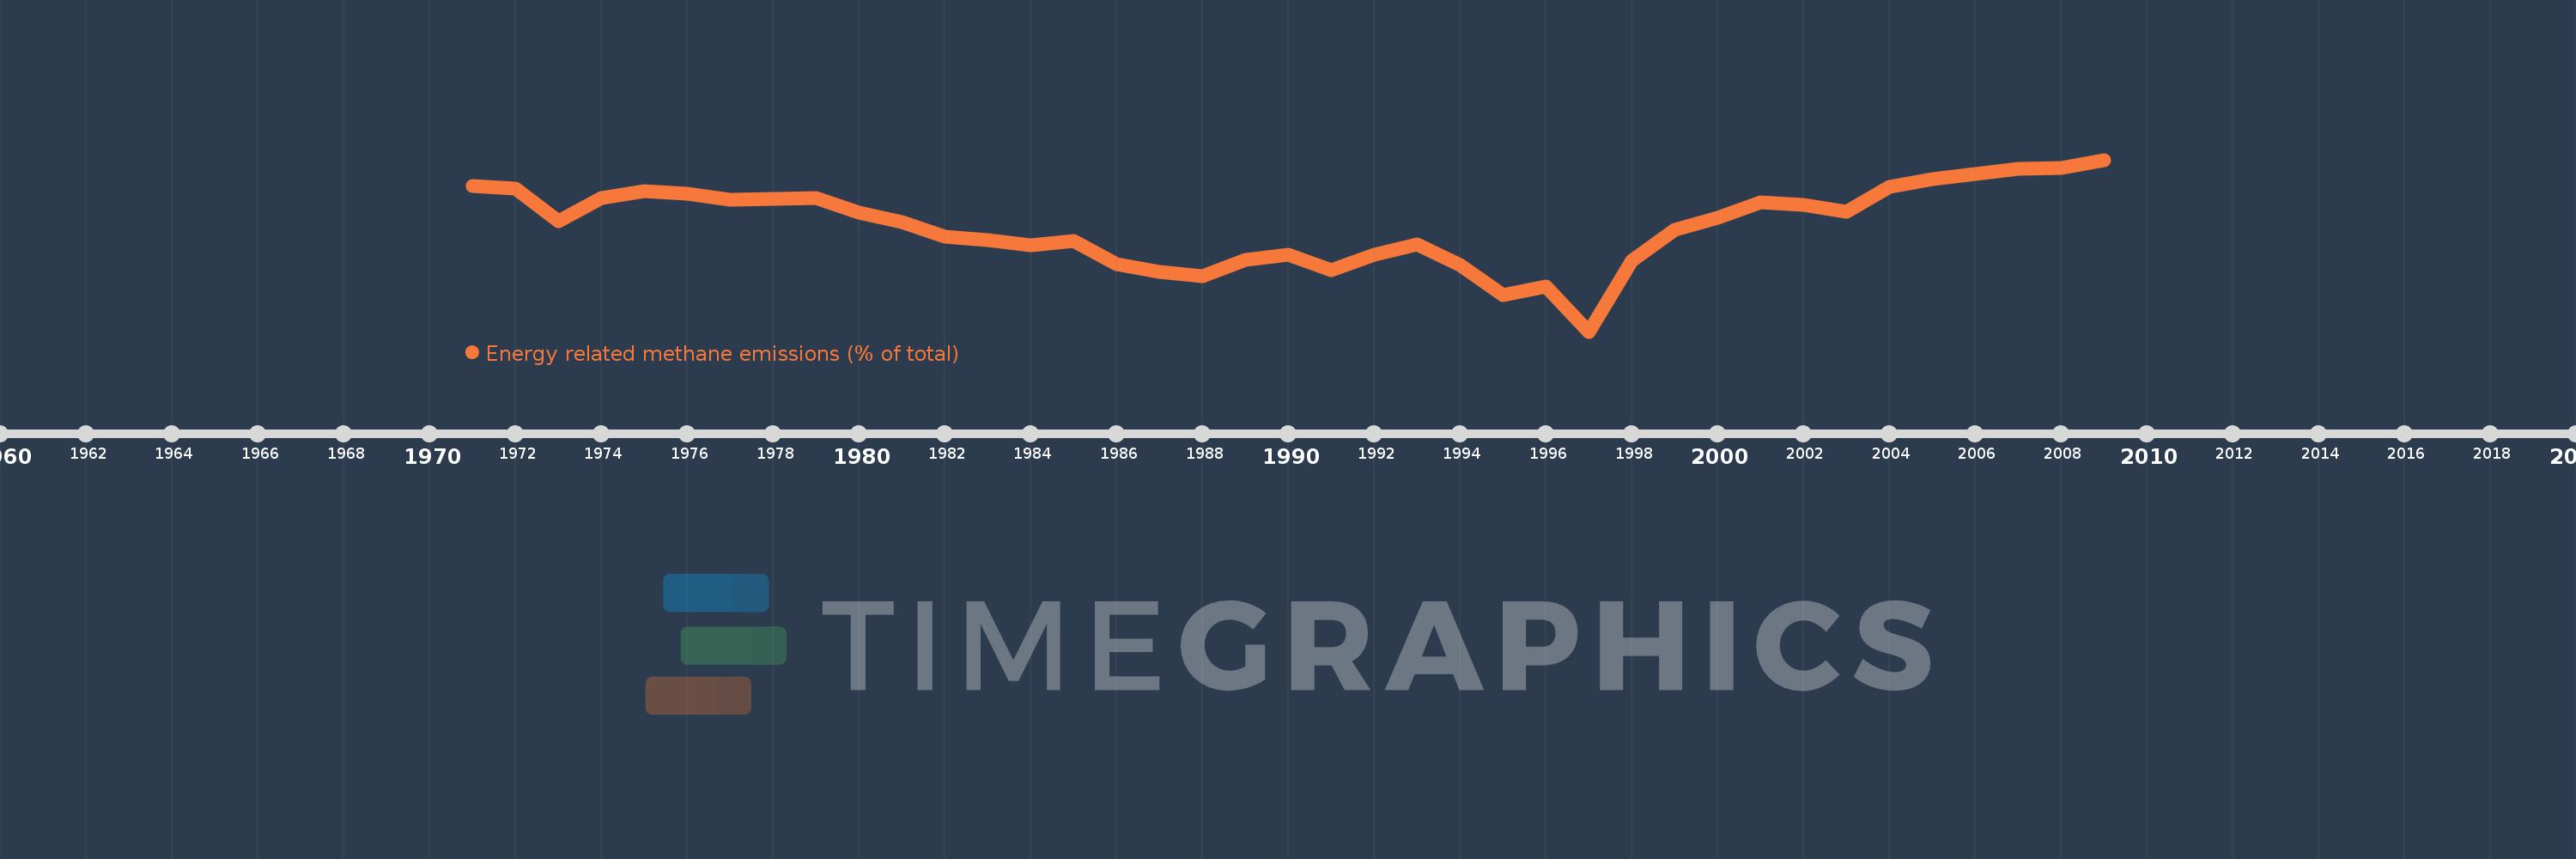
Energy related methane emissions (% of total)
2009,2008,2007,2006,2005,2004,2003,2002,2001,2000,1999,1998,1997,1996,1995,1994,1993,1992,1991,1990,1989,1988,1987,1986,1985,1984,1983,1982,1981,1980,1979,1978,1977,1976,1975,1974,1973,1972,1971
This statistics in other country:
AfghanistanAlbaniaAlgeriaAmerican SamoaAngolaAntigua and BarbudaArab WorldArgentinaArmeniaArubaAustraliaAustriaAzerbaijanBahamas, TheBahrainBangladeshBarbadosBelarusBelgiumBelizeBeninBermudaBhutanBoliviaBosnia and HerzegovinaBotswanaBrazilBritish Virgin IslandsBrunei DarussalamBulgariaBurkina FasoBurundiCabo VerdeCambodiaCameroonCanadaCaribbean small statesCayman IslandsCentral African RepublicCentral Europe and the BalticsChadChileChinaColombiaComorosCongo, Dem. Rep.Congo, Rep.Costa RicaCote d'IvoireCroatiaCubaCyprusCzech RepublicDenmarkDjiboutiDominicaDominican RepublicEarly-demographic dividendEast Asia & PacificEast Asia & Pacific (excluding high income)East Asia & Pacific (IDA & IBRD countries)EcuadorEgypt, Arab Rep.El SalvadorEquatorial GuineaEritreaEstoniaEthiopiaEuro areaEurope & Central AsiaEurope & Central Asia (excluding high income)Europe & Central Asia (IDA & IBRD countries)European UnionFaroe IslandsFijiFinlandFragile and conflict affected situationsFranceFrench PolynesiaGabonGambia, TheGeorgiaGermanyGhanaGibraltarGreeceGreenlandGrenadaGuamGuatemalaGuineaGuinea-BissauGuyanaHaitiHeavily indebted poor countries (HIPC)High incomeHondurasHong Kong SAR, ChinaHungaryIBRD onlyIcelandIDA & IBRD totalIDA blendIDA onlyIDA totalIndiaIndonesiaIran, Islamic Rep.IraqIrelandIsraelItalyJamaicaJapanJordanKazakhstanKenyaKiribatiKorea, Dem. People’s Rep.Korea, Rep.KuwaitKyrgyz RepublicLao PDRLate-demographic dividendLatin America & Caribbean Latin America & Caribbean (excluding high income)Latin America & the Caribbean (IDA & IBRD countries)LatviaLeast developed countries: UN classificationLebanonLesothoLiberiaLibyaLithuaniaLow & middle incomeLow incomeLower middle incomeLuxembourgMacao SAR, ChinaMacedonia, FYRMadagascarMalawiMalaysiaMaldivesMaliMaltaMarshall IslandsMauritaniaMauritiusMexicoMicronesia, Fed. Sts.Middle East & North AfricaMiddle East & North Africa (excluding high income)Middle East & North Africa (IDA & IBRD countries)Middle incomeMoldovaMongoliaMoroccoMozambiqueMyanmarNamibiaNauruNepalNetherlandsNew CaledoniaNew ZealandNicaraguaNigerNigeriaNorth AmericaNorthern Mariana IslandsNorwayOECD membersOmanOther small statesPacific island small statesPakistanPalauPanamaPapua New GuineaParaguayPeruPhilippinesPolandPortugalPost-demographic dividendPre-demographic dividendPuerto RicoQatarRomaniaRussian FederationRwandaSamoaSao Tome and PrincipeSaudi ArabiaSenegalSerbiaSeychellesSierra LeoneSingaporeSlovak RepublicSloveniaSmall statesSolomon IslandsSomaliaSouth AfricaSouth AsiaSouth Asia (IDA & IBRD)SpainSri LankaSt. Kitts and NevisSt. LuciaSt. Vincent and the GrenadinesSub-Saharan Africa Sub-Saharan Africa (excluding high income)Sub-Saharan Africa (IDA & IBRD countries)SudanSurinameSwazilandSwedenSwitzerlandSyrian Arab RepublicTajikistanTanzaniaThailandTimor-LesteTogoTongaTrinidad and TobagoTunisiaTurkeyTurkmenistanTurks and Caicos IslandsTuvaluUgandaUkraineUnited Arab EmiratesUnited KingdomUnited StatesUpper middle incomeUruguayUzbekistanVanuatuVenezuela, RBVietnamVirgin Islands (U.S.)WorldYemen, Rep.ZambiaZimbabwe Timeline:
This timeline shows a graph from 1971 to 2009 of Kazakhstan. No data until 1970. Number of actual observations by date: 39.
Source name:
World Development Indicators
Source organization:
World Bank staff estimates from original source: European Commission, Joint Research Centre (JRC)/Netherlands Environmental Assessment Agency (PBL). Emission Database for Global Atmospheric Research (EDGAR): http://edgar.jrc.ec.europa.eu/.
Categories, topics:
Energy & Mining, Environment
Last updated:
apr 23, 2017
Indicators value changes by year
Minimum:
38.065
jan 1, 1997
Maximum:
68.014
jan 1, 2009
At the date of observation
Value
Absolute change
Change from previous value
jan 1, 1971
63.417
+63.417
0.0%
jan 1, 1972
62.978
-0.439
-0.69%
jan 1, 1973
57.356
-5.622
-8.93%
jan 1, 1974
61.413
+4.057
7.07%
jan 1, 1975
62.511
+1.098
1.79%
jan 1, 1976
62.1
-0.411
-0.66%
jan 1, 1977
60.983
-1.117
-1.8%
jan 1, 1978
61.27
+0.287
0.47%
jan 1, 1979
61.291
+0.02
0.03%
jan 1, 1980
58.745
-2.546
-4.15%
jan 1, 1981
57.1
-1.645
-2.8%
jan 1, 1982
54.569
-2.531
-4.43%
jan 1, 1983
54.016
-0.553
-1.01%
jan 1, 1984
53.079
-0.937
-1.73%
jan 1, 1985
53.793
+0.714
1.35%
jan 1, 1986
49.89
-3.903
-7.26%
jan 1, 1987
48.462
-1.428
-2.86%
jan 1, 1988
47.652
-0.81
-1.67%
jan 1, 1989
50.534
+2.882
6.05%
jan 1, 1990
51.447
+0.913
1.81%
jan 1, 1991
48.777
-2.669
-5.19%
jan 1, 1992
51.422
+2.645
5.42%
jan 1, 1993
53.272
+1.85
3.6%
jan 1, 1994
49.74
-3.532
-6.63%
jan 1, 1995
44.493
-5.247
-10.55%
jan 1, 1996
45.879
+1.387
3.12%
jan 1, 1997
38.065
-7.814
-17.03%
jan 1, 1998
50.432
+12.367
32.49%
jan 1, 1999
55.775
+5.343
10.59%
jan 1, 2000
57.864
+2.089
3.74%
jan 1, 2001
60.537
+2.674
4.62%
jan 1, 2002
60.127
-0.411
-0.68%
jan 1, 2003
58.952
-1.175
-1.95%
jan 1, 2004
63.256
+4.305
7.3%
jan 1, 2005
64.648
+1.392
2.2%
jan 1, 2006
65.511
+0.863
1.33%
jan 1, 2007
66.458
+0.947
1.45%
jan 1, 2008
66.59
+0.132
0.2%
jan 1, 2009
68.014
+1.424
2.14%
Ranking of countries by current statistics by years


Comments: