29
/
en
AIzaSyAYiBZKx7MnpbEhh9jyipgxe19OcubqV5w
April 1, 2024
171630
Kuwait
KWT
true
2
1
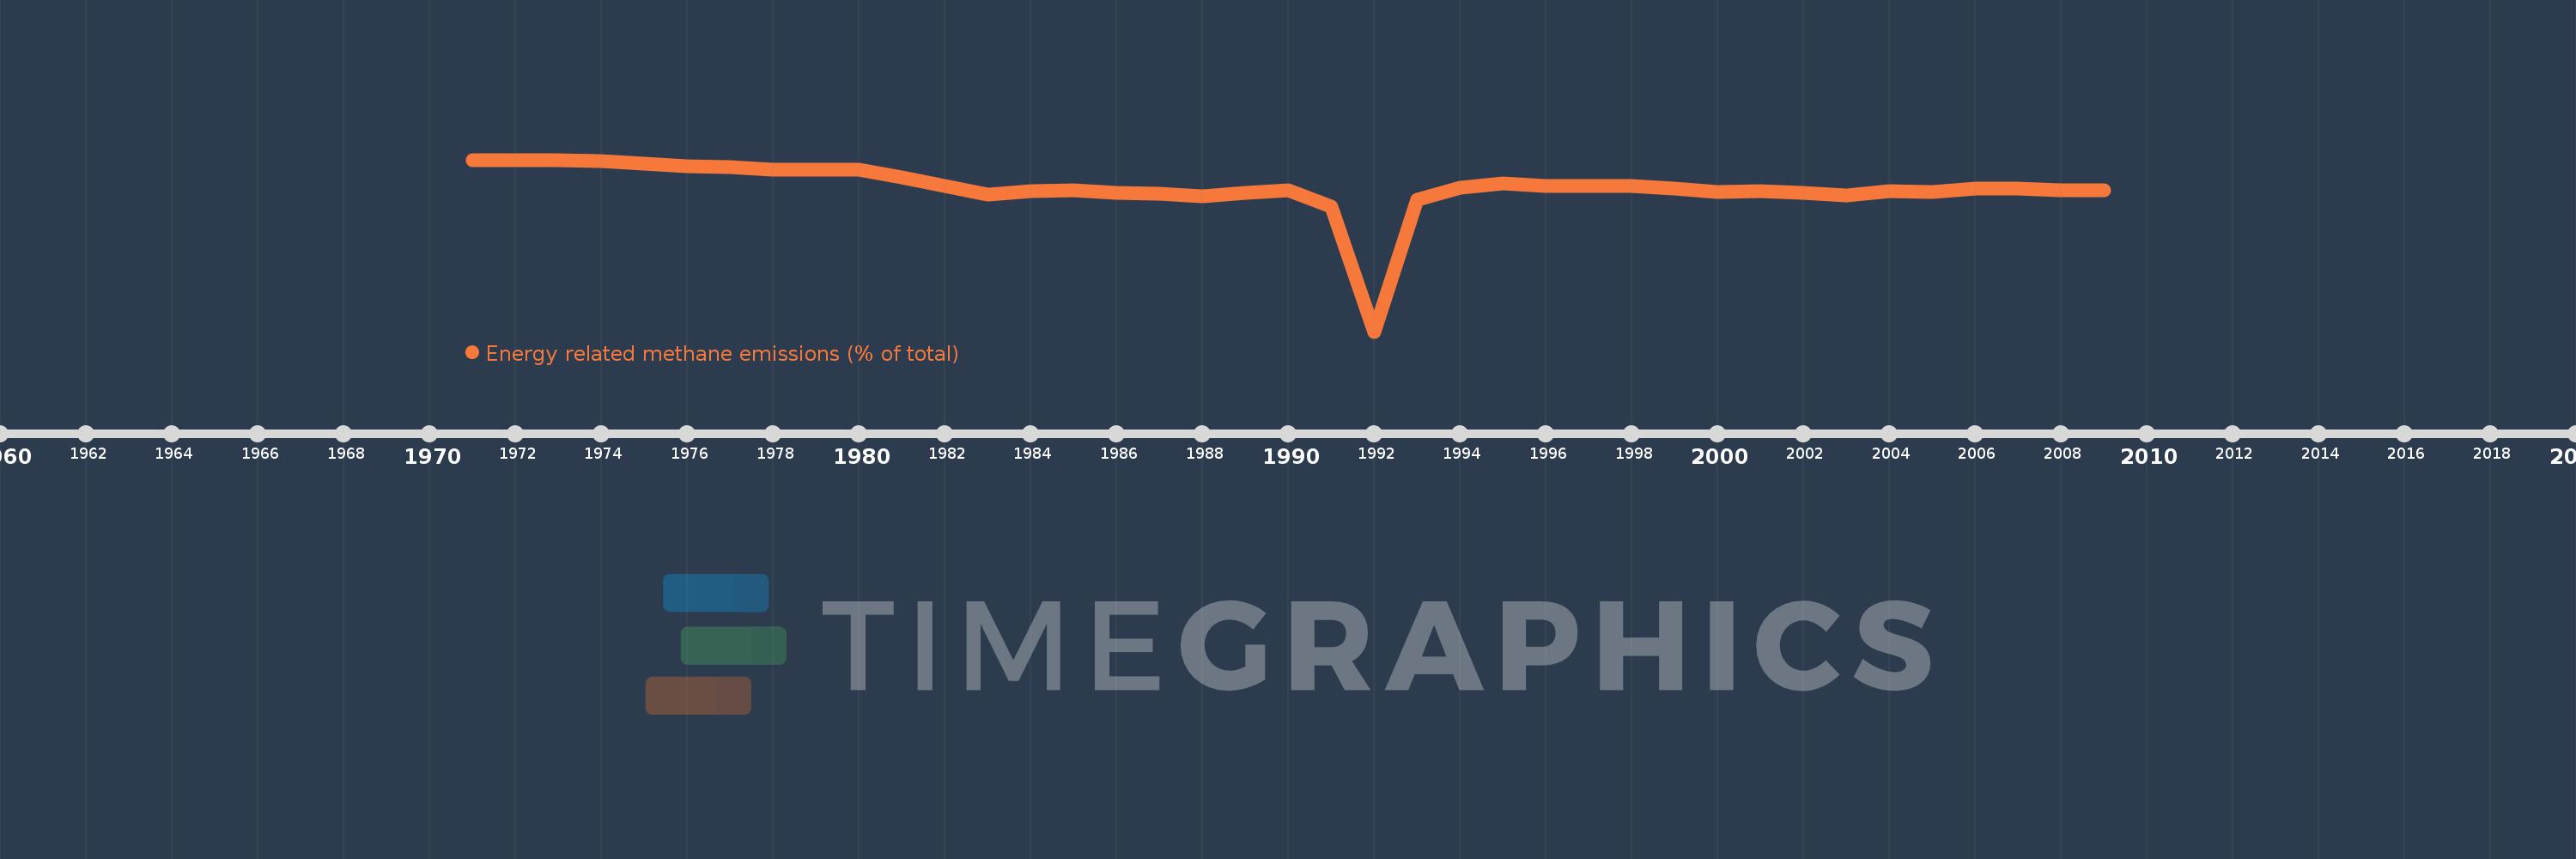
Energy related methane emissions (% of total)
2009,2008,2007,2006,2005,2004,2003,2002,2001,2000,1999,1998,1997,1996,1995,1994,1993,1992,1991,1990,1989,1988,1987,1986,1985,1984,1983,1982,1981,1980,1979,1978,1977,1976,1975,1974,1973,1972,1971
This statistics in other country:
AfghanistanAlbaniaAlgeriaAmerican SamoaAngolaAntigua and BarbudaArab WorldArgentinaArmeniaArubaAustraliaAustriaAzerbaijanBahamas, TheBahrainBangladeshBarbadosBelarusBelgiumBelizeBeninBermudaBhutanBoliviaBosnia and HerzegovinaBotswanaBrazilBritish Virgin IslandsBrunei DarussalamBulgariaBurkina FasoBurundiCabo VerdeCambodiaCameroonCanadaCaribbean small statesCayman IslandsCentral African RepublicCentral Europe and the BalticsChadChileChinaColombiaComorosCongo, Dem. Rep.Congo, Rep.Costa RicaCote d'IvoireCroatiaCubaCyprusCzech RepublicDenmarkDjiboutiDominicaDominican RepublicEarly-demographic dividendEast Asia & PacificEast Asia & Pacific (excluding high income)East Asia & Pacific (IDA & IBRD countries)EcuadorEgypt, Arab Rep.El SalvadorEquatorial GuineaEritreaEstoniaEthiopiaEuro areaEurope & Central AsiaEurope & Central Asia (excluding high income)Europe & Central Asia (IDA & IBRD countries)European UnionFaroe IslandsFijiFinlandFragile and conflict affected situationsFranceFrench PolynesiaGabonGambia, TheGeorgiaGermanyGhanaGibraltarGreeceGreenlandGrenadaGuamGuatemalaGuineaGuinea-BissauGuyanaHaitiHeavily indebted poor countries (HIPC)High incomeHondurasHong Kong SAR, ChinaHungaryIBRD onlyIcelandIDA & IBRD totalIDA blendIDA onlyIDA totalIndiaIndonesiaIran, Islamic Rep.IraqIrelandIsraelItalyJamaicaJapanJordanKazakhstanKenyaKiribatiKorea, Dem. People’s Rep.Korea, Rep.KuwaitKyrgyz RepublicLao PDRLate-demographic dividendLatin America & Caribbean Latin America & Caribbean (excluding high income)Latin America & the Caribbean (IDA & IBRD countries)LatviaLeast developed countries: UN classificationLebanonLesothoLiberiaLibyaLithuaniaLow & middle incomeLow incomeLower middle incomeLuxembourgMacao SAR, ChinaMacedonia, FYRMadagascarMalawiMalaysiaMaldivesMaliMaltaMarshall IslandsMauritaniaMauritiusMexicoMicronesia, Fed. Sts.Middle East & North AfricaMiddle East & North Africa (excluding high income)Middle East & North Africa (IDA & IBRD countries)Middle incomeMoldovaMongoliaMoroccoMozambiqueMyanmarNamibiaNauruNepalNetherlandsNew CaledoniaNew ZealandNicaraguaNigerNigeriaNorth AmericaNorthern Mariana IslandsNorwayOECD membersOmanOther small statesPacific island small statesPakistanPalauPanamaPapua New GuineaParaguayPeruPhilippinesPolandPortugalPost-demographic dividendPre-demographic dividendPuerto RicoQatarRomaniaRussian FederationRwandaSamoaSao Tome and PrincipeSaudi ArabiaSenegalSerbiaSeychellesSierra LeoneSingaporeSlovak RepublicSloveniaSmall statesSolomon IslandsSomaliaSouth AfricaSouth AsiaSouth Asia (IDA & IBRD)SpainSri LankaSt. Kitts and NevisSt. LuciaSt. Vincent and the GrenadinesSub-Saharan Africa Sub-Saharan Africa (excluding high income)Sub-Saharan Africa (IDA & IBRD countries)SudanSurinameSwazilandSwedenSwitzerlandSyrian Arab RepublicTajikistanTanzaniaThailandTimor-LesteTogoTongaTrinidad and TobagoTunisiaTurkeyTurkmenistanTurks and Caicos IslandsTuvaluUgandaUkraineUnited Arab EmiratesUnited KingdomUnited StatesUpper middle incomeUruguayUzbekistanVanuatuVenezuela, RBVietnamVirgin Islands (U.S.)WorldYemen, Rep.ZambiaZimbabwe Timeline:
This timeline shows a graph from 1971 to 2009 of Kuwait. No data until 1970. Number of actual observations by date: 39.
Source name:
World Development Indicators
Source organization:
World Bank staff estimates from original source: European Commission, Joint Research Centre (JRC)/Netherlands Environmental Assessment Agency (PBL). Emission Database for Global Atmospheric Research (EDGAR): http://edgar.jrc.ec.europa.eu/.
Categories, topics:
Energy & Mining, Environment
Last updated:
apr 23, 2017
Indicators value changes by year
Minimum:
60.501
jan 1, 1992
Maximum:
99.152
jan 1, 1971
At the date of observation
Value
Absolute change
Change from previous value
jan 1, 1971
99.152
+99.152
0.0%
jan 1, 1972
99.099
-0.053
-0.05%
jan 1, 1973
99.005
-0.095
-0.1%
jan 1, 1974
98.768
-0.237
-0.24%
jan 1, 1975
98.314
-0.453
-0.46%
jan 1, 1976
97.777
-0.537
-0.55%
jan 1, 1977
97.413
-0.364
-0.37%
jan 1, 1978
96.906
-0.508
-0.52%
jan 1, 1979
96.983
+0.077
0.08%
jan 1, 1980
96.847
-0.136
-0.14%
jan 1, 1981
95.22
-1.627
-1.68%
jan 1, 1982
93.269
-1.951
-2.05%
jan 1, 1983
91.332
-1.937
-2.08%
jan 1, 1984
92.128
+0.796
0.87%
jan 1, 1985
92.319
+0.191
0.21%
jan 1, 1986
91.759
-0.561
-0.61%
jan 1, 1987
91.534
-0.225
-0.25%
jan 1, 1988
90.864
-0.67
-0.73%
jan 1, 1989
91.665
+0.802
0.88%
jan 1, 1990
92.331
+0.665
0.73%
jan 1, 1991
88.653
-3.677
-3.98%
jan 1, 1992
60.501
-28.152
-31.76%
jan 1, 1993
90.257
+29.756
49.18%
jan 1, 1994
92.841
+2.583
2.86%
jan 1, 1995
93.856
+1.015
1.09%
jan 1, 1996
93.321
-0.535
-0.57%
jan 1, 1997
93.289
-0.032
-0.03%
jan 1, 1998
93.191
-0.098
-0.1%
jan 1, 1999
92.634
-0.557
-0.6%
jan 1, 2000
91.82
-0.814
-0.88%
jan 1, 2001
92.058
+0.237
0.26%
jan 1, 2002
91.7
-0.358
-0.39%
jan 1, 2003
91.212
-0.488
-0.53%
jan 1, 2004
92.037
+0.824
0.9%
jan 1, 2005
91.996
-0.04
-0.04%
jan 1, 2006
92.712
+0.716
0.78%
jan 1, 2007
92.684
-0.028
-0.03%
jan 1, 2008
92.314
-0.37
-0.4%
jan 1, 2009
92.254
-0.06
-0.07%
Ranking of countries by current statistics by years


Comments: