29
/
en
AIzaSyAYiBZKx7MnpbEhh9jyipgxe19OcubqV5w
April 1, 2024
123405
Ecuador
ECU
true
2
1
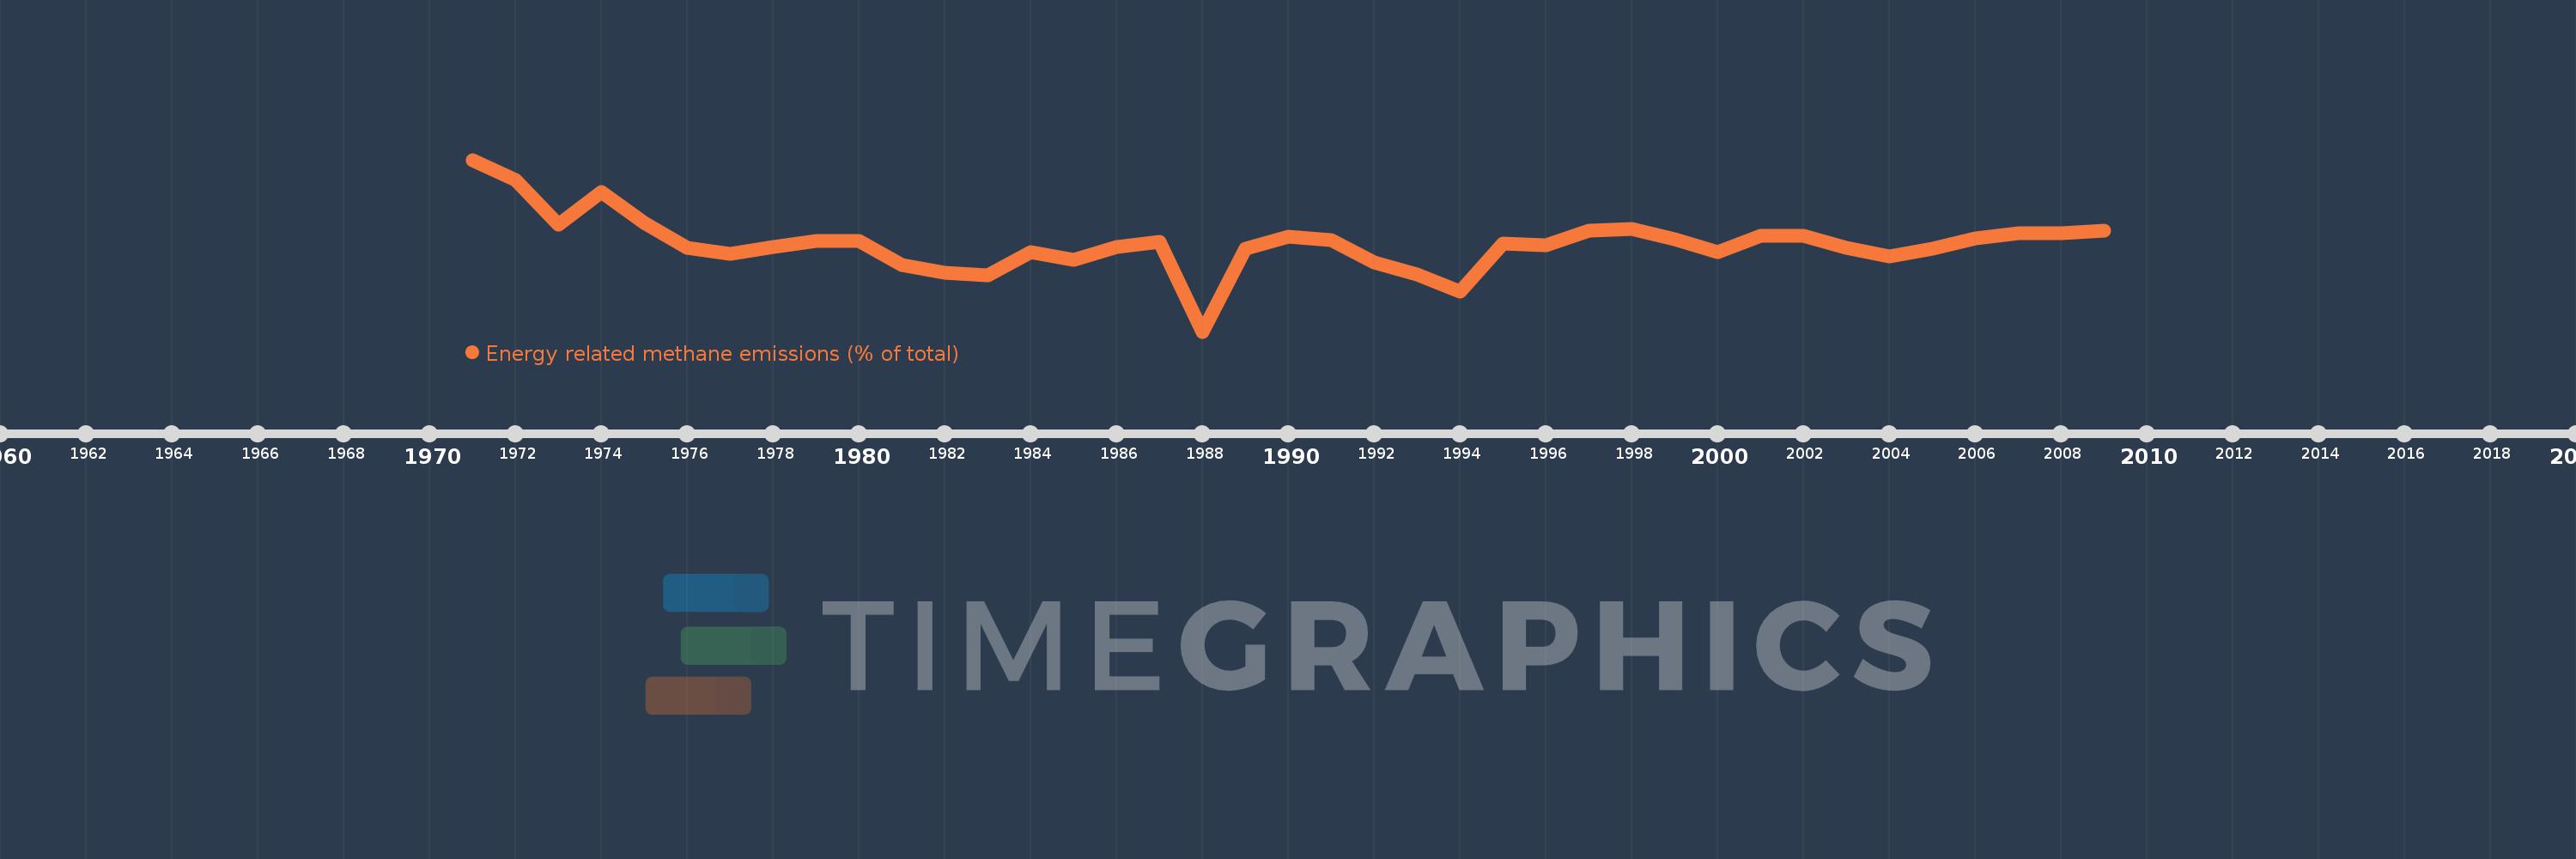
Energy related methane emissions (% of total)
2009,2008,2007,2006,2005,2004,2003,2002,2001,2000,1999,1998,1997,1996,1995,1994,1993,1992,1991,1990,1989,1988,1987,1986,1985,1984,1983,1982,1981,1980,1979,1978,1977,1976,1975,1974,1973,1972,1971
This statistics in other country:
AfghanistanAlbaniaAlgeriaAmerican SamoaAngolaAntigua and BarbudaArab WorldArgentinaArmeniaArubaAustraliaAustriaAzerbaijanBahamas, TheBahrainBangladeshBarbadosBelarusBelgiumBelizeBeninBermudaBhutanBoliviaBosnia and HerzegovinaBotswanaBrazilBritish Virgin IslandsBrunei DarussalamBulgariaBurkina FasoBurundiCabo VerdeCambodiaCameroonCanadaCaribbean small statesCayman IslandsCentral African RepublicCentral Europe and the BalticsChadChileChinaColombiaComorosCongo, Dem. Rep.Congo, Rep.Costa RicaCote d'IvoireCroatiaCubaCyprusCzech RepublicDenmarkDjiboutiDominicaDominican RepublicEarly-demographic dividendEast Asia & PacificEast Asia & Pacific (excluding high income)East Asia & Pacific (IDA & IBRD countries)EcuadorEgypt, Arab Rep.El SalvadorEquatorial GuineaEritreaEstoniaEthiopiaEuro areaEurope & Central AsiaEurope & Central Asia (excluding high income)Europe & Central Asia (IDA & IBRD countries)European UnionFaroe IslandsFijiFinlandFragile and conflict affected situationsFranceFrench PolynesiaGabonGambia, TheGeorgiaGermanyGhanaGibraltarGreeceGreenlandGrenadaGuamGuatemalaGuineaGuinea-BissauGuyanaHaitiHeavily indebted poor countries (HIPC)High incomeHondurasHong Kong SAR, ChinaHungaryIBRD onlyIcelandIDA & IBRD totalIDA blendIDA onlyIDA totalIndiaIndonesiaIran, Islamic Rep.IraqIrelandIsraelItalyJamaicaJapanJordanKazakhstanKenyaKiribatiKorea, Dem. People’s Rep.Korea, Rep.KuwaitKyrgyz RepublicLao PDRLate-demographic dividendLatin America & Caribbean Latin America & Caribbean (excluding high income)Latin America & the Caribbean (IDA & IBRD countries)LatviaLeast developed countries: UN classificationLebanonLesothoLiberiaLibyaLithuaniaLow & middle incomeLow incomeLower middle incomeLuxembourgMacao SAR, ChinaMacedonia, FYRMadagascarMalawiMalaysiaMaldivesMaliMaltaMarshall IslandsMauritaniaMauritiusMexicoMicronesia, Fed. Sts.Middle East & North AfricaMiddle East & North Africa (excluding high income)Middle East & North Africa (IDA & IBRD countries)Middle incomeMoldovaMongoliaMoroccoMozambiqueMyanmarNamibiaNauruNepalNetherlandsNew CaledoniaNew ZealandNicaraguaNigerNigeriaNorth AmericaNorthern Mariana IslandsNorwayOECD membersOmanOther small statesPacific island small statesPakistanPalauPanamaPapua New GuineaParaguayPeruPhilippinesPolandPortugalPost-demographic dividendPre-demographic dividendPuerto RicoQatarRomaniaRussian FederationRwandaSamoaSao Tome and PrincipeSaudi ArabiaSenegalSerbiaSeychellesSierra LeoneSingaporeSlovak RepublicSloveniaSmall statesSolomon IslandsSomaliaSouth AfricaSouth AsiaSouth Asia (IDA & IBRD)SpainSri LankaSt. Kitts and NevisSt. LuciaSt. Vincent and the GrenadinesSub-Saharan Africa Sub-Saharan Africa (excluding high income)Sub-Saharan Africa (IDA & IBRD countries)SudanSurinameSwazilandSwedenSwitzerlandSyrian Arab RepublicTajikistanTanzaniaThailandTimor-LesteTogoTongaTrinidad and TobagoTunisiaTurkeyTurkmenistanTurks and Caicos IslandsTuvaluUgandaUkraineUnited Arab EmiratesUnited KingdomUnited StatesUpper middle incomeUruguayUzbekistanVanuatuVenezuela, RBVietnamVirgin Islands (U.S.)WorldYemen, Rep.ZambiaZimbabwe Timeline:
This timeline shows a graph from 1971 to 2009 of Ecuador. No data until 1970. Number of actual observations by date: 39.
Source name:
World Development Indicators
Source organization:
World Bank staff estimates from original source: European Commission, Joint Research Centre (JRC)/Netherlands Environmental Assessment Agency (PBL). Emission Database for Global Atmospheric Research (EDGAR): http://edgar.jrc.ec.europa.eu/.
Categories, topics:
Energy & Mining, Environment
Last updated:
apr 23, 2017
Indicators value changes by year
Minimum:
15.736
jan 1, 1988
Maximum:
27.586
jan 1, 1971
At the date of observation
Value
Absolute change
Change from previous value
jan 1, 1971
27.586
+27.586
0.0%
jan 1, 1972
26.223
-1.362
-4.94%
jan 1, 1973
23.086
-3.137
-11.96%
jan 1, 1974
25.353
+2.267
9.82%
jan 1, 1975
23.258
-2.095
-8.26%
jan 1, 1976
21.489
-1.769
-7.61%
jan 1, 1977
21.088
-0.4
-1.86%
jan 1, 1978
21.549
+0.46
2.18%
jan 1, 1979
22.016
+0.467
2.17%
jan 1, 1980
21.978
-0.038
-0.17%
jan 1, 1981
20.304
-1.674
-7.62%
jan 1, 1982
19.818
-0.486
-2.4%
jan 1, 1983
19.591
-0.226
-1.14%
jan 1, 1984
21.208
+1.617
8.25%
jan 1, 1985
20.672
-0.536
-2.53%
jan 1, 1986
21.582
+0.91
4.4%
jan 1, 1987
21.908
+0.326
1.51%
jan 1, 1988
15.736
-6.172
-28.17%
jan 1, 1989
21.478
+5.742
36.49%
jan 1, 1990
22.306
+0.828
3.86%
jan 1, 1991
22.038
-0.268
-1.2%
jan 1, 1992
20.489
-1.549
-7.03%
jan 1, 1993
19.658
-0.831
-4.06%
jan 1, 1994
18.518
-1.14
-5.8%
jan 1, 1995
21.781
+3.264
17.63%
jan 1, 1996
21.67
-0.111
-0.51%
jan 1, 1997
22.681
+1.011
4.67%
jan 1, 1998
22.815
+0.133
0.59%
jan 1, 1999
22.098
-0.717
-3.14%
jan 1, 2000
21.238
-0.86
-3.89%
jan 1, 2001
22.371
+1.133
5.33%
jan 1, 2002
22.352
-0.019
-0.08%
jan 1, 2003
21.533
-0.819
-3.66%
jan 1, 2004
20.95
-0.583
-2.71%
jan 1, 2005
21.469
+0.519
2.48%
jan 1, 2006
22.194
+0.725
3.38%
jan 1, 2007
22.495
+0.301
1.36%
jan 1, 2008
22.524
+0.029
0.13%
jan 1, 2009
22.723
+0.198
0.88%
Ranking of countries by current statistics by years


Comments: