29
/
en
AIzaSyAYiBZKx7MnpbEhh9jyipgxe19OcubqV5w
April 1, 2024
215203
Oman
OMN
true
2
1
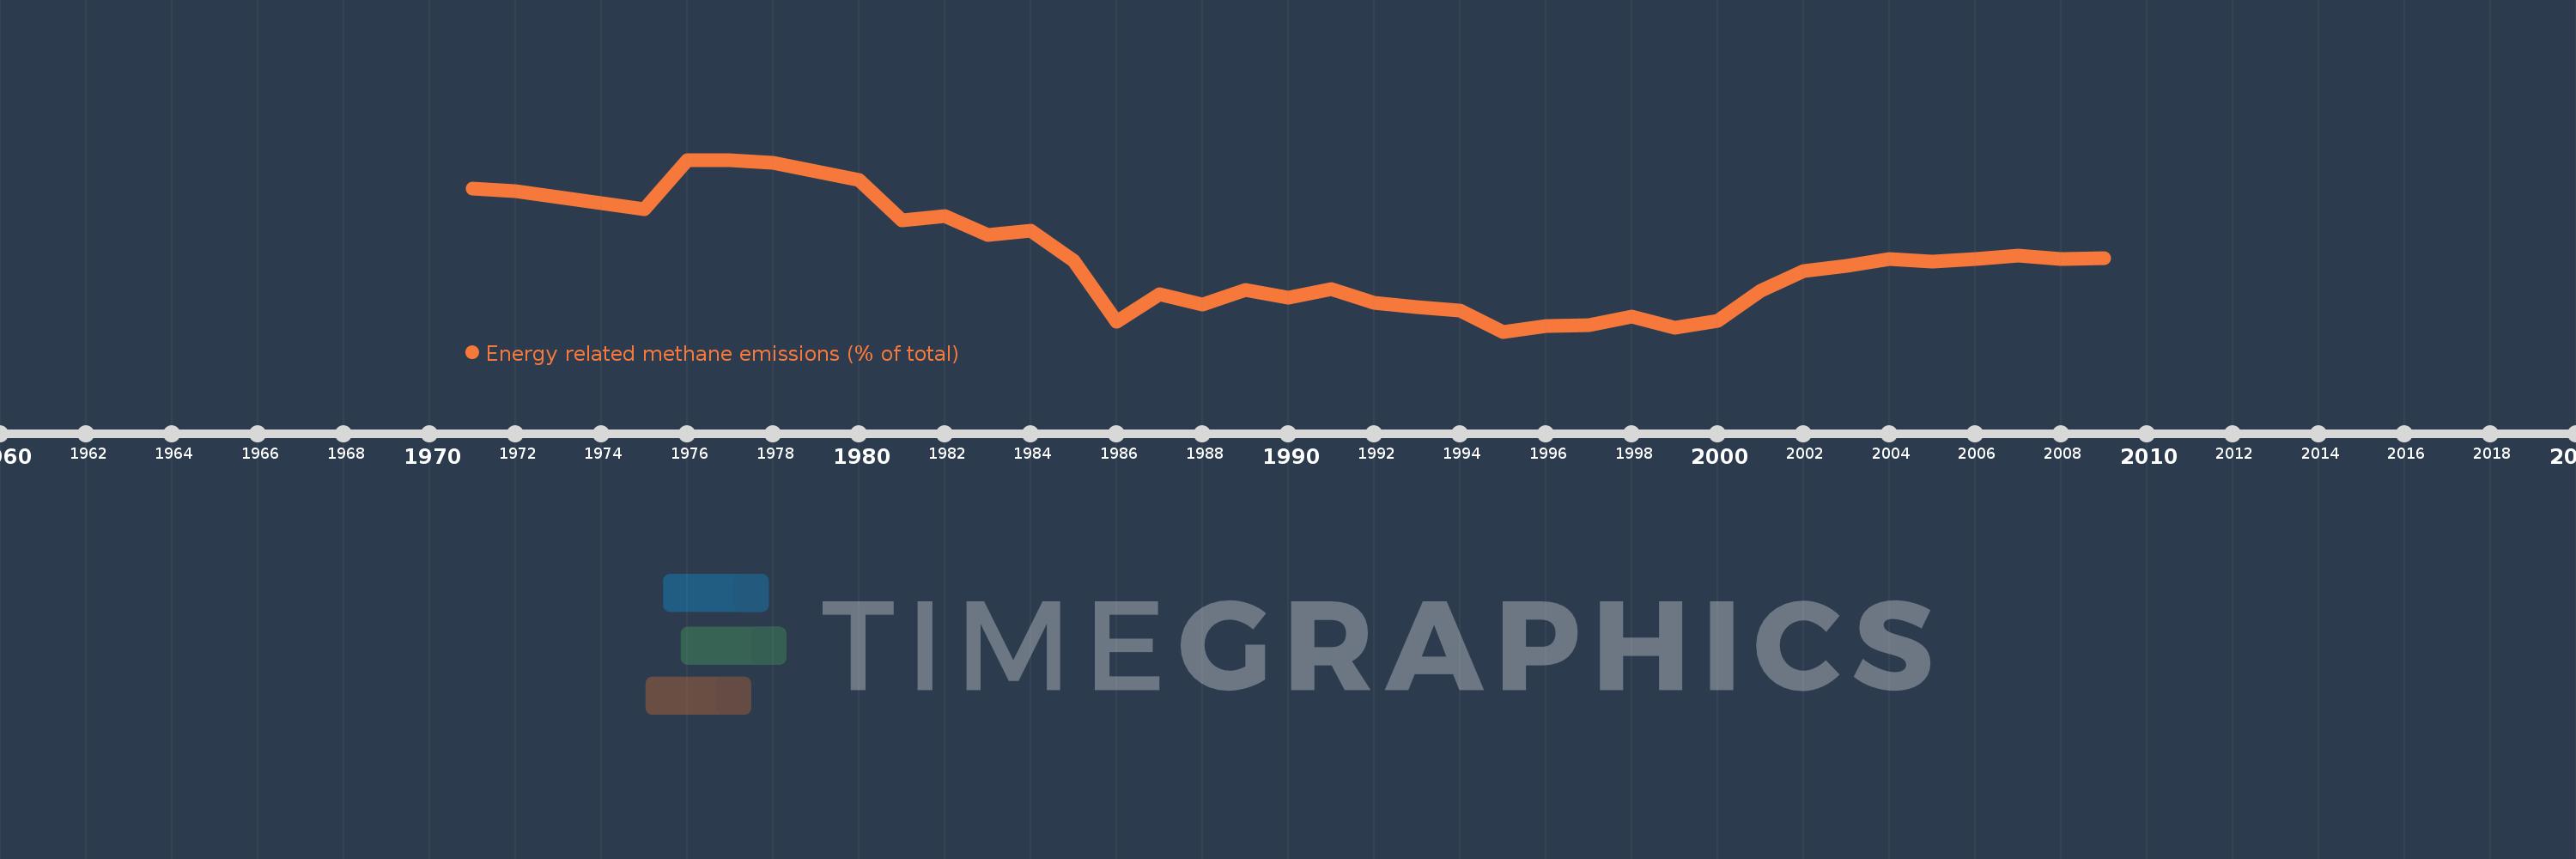
Energy related methane emissions (% of total)
2009,2008,2007,2006,2005,2004,2003,2002,2001,2000,1999,1998,1997,1996,1995,1994,1993,1992,1991,1990,1989,1988,1987,1986,1985,1984,1983,1982,1981,1980,1979,1978,1977,1976,1975,1974,1973,1972,1971
This statistics in other country:
AfghanistanAlbaniaAlgeriaAmerican SamoaAngolaAntigua and BarbudaArab WorldArgentinaArmeniaArubaAustraliaAustriaAzerbaijanBahamas, TheBahrainBangladeshBarbadosBelarusBelgiumBelizeBeninBermudaBhutanBoliviaBosnia and HerzegovinaBotswanaBrazilBritish Virgin IslandsBrunei DarussalamBulgariaBurkina FasoBurundiCabo VerdeCambodiaCameroonCanadaCaribbean small statesCayman IslandsCentral African RepublicCentral Europe and the BalticsChadChileChinaColombiaComorosCongo, Dem. Rep.Congo, Rep.Costa RicaCote d'IvoireCroatiaCubaCyprusCzech RepublicDenmarkDjiboutiDominicaDominican RepublicEarly-demographic dividendEast Asia & PacificEast Asia & Pacific (excluding high income)East Asia & Pacific (IDA & IBRD countries)EcuadorEgypt, Arab Rep.El SalvadorEquatorial GuineaEritreaEstoniaEthiopiaEuro areaEurope & Central AsiaEurope & Central Asia (excluding high income)Europe & Central Asia (IDA & IBRD countries)European UnionFaroe IslandsFijiFinlandFragile and conflict affected situationsFranceFrench PolynesiaGabonGambia, TheGeorgiaGermanyGhanaGibraltarGreeceGreenlandGrenadaGuamGuatemalaGuineaGuinea-BissauGuyanaHaitiHeavily indebted poor countries (HIPC)High incomeHondurasHong Kong SAR, ChinaHungaryIBRD onlyIcelandIDA & IBRD totalIDA blendIDA onlyIDA totalIndiaIndonesiaIran, Islamic Rep.IraqIrelandIsraelItalyJamaicaJapanJordanKazakhstanKenyaKiribatiKorea, Dem. People’s Rep.Korea, Rep.KuwaitKyrgyz RepublicLao PDRLate-demographic dividendLatin America & Caribbean Latin America & Caribbean (excluding high income)Latin America & the Caribbean (IDA & IBRD countries)LatviaLeast developed countries: UN classificationLebanonLesothoLiberiaLibyaLithuaniaLow & middle incomeLow incomeLower middle incomeLuxembourgMacao SAR, ChinaMacedonia, FYRMadagascarMalawiMalaysiaMaldivesMaliMaltaMarshall IslandsMauritaniaMauritiusMexicoMicronesia, Fed. Sts.Middle East & North AfricaMiddle East & North Africa (excluding high income)Middle East & North Africa (IDA & IBRD countries)Middle incomeMoldovaMongoliaMoroccoMozambiqueMyanmarNamibiaNauruNepalNetherlandsNew CaledoniaNew ZealandNicaraguaNigerNigeriaNorth AmericaNorthern Mariana IslandsNorwayOECD membersOmanOther small statesPacific island small statesPakistanPalauPanamaPapua New GuineaParaguayPeruPhilippinesPolandPortugalPost-demographic dividendPre-demographic dividendPuerto RicoQatarRomaniaRussian FederationRwandaSamoaSao Tome and PrincipeSaudi ArabiaSenegalSerbiaSeychellesSierra LeoneSingaporeSlovak RepublicSloveniaSmall statesSolomon IslandsSomaliaSouth AfricaSouth AsiaSouth Asia (IDA & IBRD)SpainSri LankaSt. Kitts and NevisSt. LuciaSt. Vincent and the GrenadinesSub-Saharan Africa Sub-Saharan Africa (excluding high income)Sub-Saharan Africa (IDA & IBRD countries)SudanSurinameSwazilandSwedenSwitzerlandSyrian Arab RepublicTajikistanTanzaniaThailandTimor-LesteTogoTongaTrinidad and TobagoTunisiaTurkeyTurkmenistanTurks and Caicos IslandsTuvaluUgandaUkraineUnited Arab EmiratesUnited KingdomUnited StatesUpper middle incomeUruguayUzbekistanVanuatuVenezuela, RBVietnamVirgin Islands (U.S.)WorldYemen, Rep.ZambiaZimbabwe Timeline:
This timeline shows a graph from 1971 to 2009 of Oman. No data until 1970. Number of actual observations by date: 39.
Source name:
World Development Indicators
Source organization:
World Bank staff estimates from original source: European Commission, Joint Research Centre (JRC)/Netherlands Environmental Assessment Agency (PBL). Emission Database for Global Atmospheric Research (EDGAR): http://edgar.jrc.ec.europa.eu/.
Categories, topics:
Energy & Mining, Environment
Last updated:
apr 23, 2017
Indicators value changes by year
Minimum:
88.618
jan 1, 1995
Maximum:
98.414
jan 1, 1976
At the date of observation
Value
Absolute change
Change from previous value
jan 1, 1971
96.754
+96.754
0.0%
jan 1, 1972
96.603
-0.151
-0.16%
jan 1, 1973
96.283
-0.32
-0.33%
jan 1, 1974
95.945
-0.338
-0.35%
jan 1, 1975
95.617
-0.328
-0.34%
jan 1, 1976
98.414
+2.797
2.93%
jan 1, 1977
98.413
-0.001
0.0%
jan 1, 1978
98.253
-0.16
-0.16%
jan 1, 1979
97.733
-0.52
-0.53%
jan 1, 1980
97.267
-0.465
-0.48%
jan 1, 1981
94.982
-2.285
-2.35%
jan 1, 1982
95.211
+0.228
0.24%
jan 1, 1983
94.13
-1.081
-1.14%
jan 1, 1984
94.354
+0.225
0.24%
jan 1, 1985
92.638
-1.716
-1.82%
jan 1, 1986
89.178
-3.46
-3.74%
jan 1, 1987
90.768
+1.59
1.78%
jan 1, 1988
90.171
-0.597
-0.66%
jan 1, 1989
90.998
+0.827
0.92%
jan 1, 1990
90.558
-0.44
-0.48%
jan 1, 1991
91.041
+0.483
0.53%
jan 1, 1992
90.249
-0.793
-0.87%
jan 1, 1993
90.018
-0.23
-0.26%
jan 1, 1994
89.802
-0.216
-0.24%
jan 1, 1995
88.618
-1.184
-1.32%
jan 1, 1996
88.932
+0.314
0.35%
jan 1, 1997
88.981
+0.048
0.05%
jan 1, 1998
89.46
+0.479
0.54%
jan 1, 1999
88.858
-0.602
-0.67%
jan 1, 2000
89.249
+0.392
0.44%
jan 1, 2001
90.934
+1.685
1.89%
jan 1, 2002
92.092
+1.159
1.27%
jan 1, 2003
92.35
+0.258
0.28%
jan 1, 2004
92.738
+0.388
0.42%
jan 1, 2005
92.633
-0.106
-0.11%
jan 1, 2006
92.737
+0.105
0.11%
jan 1, 2007
92.962
+0.224
0.24%
jan 1, 2008
92.779
-0.183
-0.2%
jan 1, 2009
92.81
+0.031
0.03%
Ranking of countries by current statistics by years


Comments: