29
/
en
AIzaSyAYiBZKx7MnpbEhh9jyipgxe19OcubqV5w
April 1, 2024
101017
Canada
CAN
true
2
1
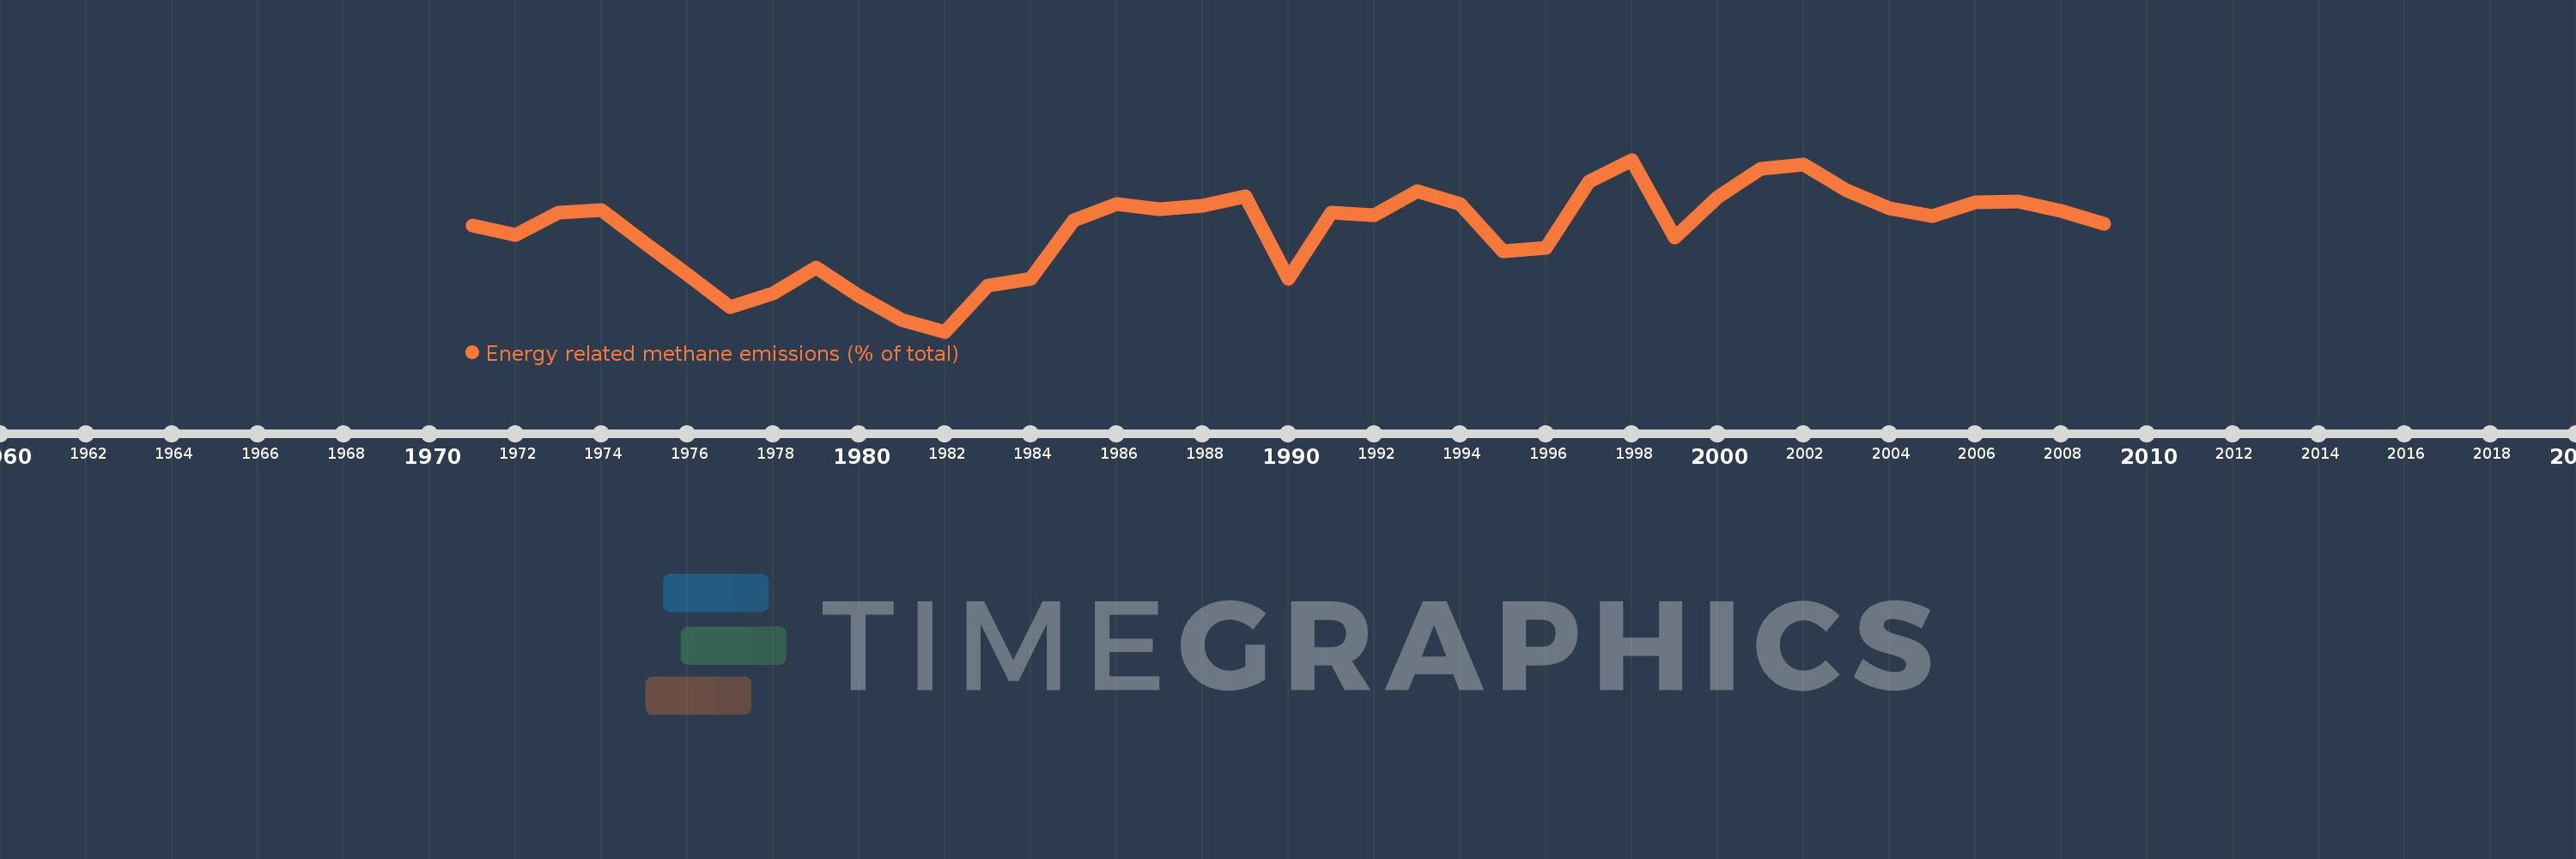
Energy related methane emissions (% of total)
2009,2008,2007,2006,2005,2004,2003,2002,2001,2000,1999,1998,1997,1996,1995,1994,1993,1992,1991,1990,1989,1988,1987,1986,1985,1984,1983,1982,1981,1980,1979,1978,1977,1976,1975,1974,1973,1972,1971
This statistics in other country:
AfghanistanAlbaniaAlgeriaAmerican SamoaAngolaAntigua and BarbudaArab WorldArgentinaArmeniaArubaAustraliaAustriaAzerbaijanBahamas, TheBahrainBangladeshBarbadosBelarusBelgiumBelizeBeninBermudaBhutanBoliviaBosnia and HerzegovinaBotswanaBrazilBritish Virgin IslandsBrunei DarussalamBulgariaBurkina FasoBurundiCabo VerdeCambodiaCameroonCanadaCaribbean small statesCayman IslandsCentral African RepublicCentral Europe and the BalticsChadChileChinaColombiaComorosCongo, Dem. Rep.Congo, Rep.Costa RicaCote d'IvoireCroatiaCubaCyprusCzech RepublicDenmarkDjiboutiDominicaDominican RepublicEarly-demographic dividendEast Asia & PacificEast Asia & Pacific (excluding high income)East Asia & Pacific (IDA & IBRD countries)EcuadorEgypt, Arab Rep.El SalvadorEquatorial GuineaEritreaEstoniaEthiopiaEuro areaEurope & Central AsiaEurope & Central Asia (excluding high income)Europe & Central Asia (IDA & IBRD countries)European UnionFaroe IslandsFijiFinlandFragile and conflict affected situationsFranceFrench PolynesiaGabonGambia, TheGeorgiaGermanyGhanaGibraltarGreeceGreenlandGrenadaGuamGuatemalaGuineaGuinea-BissauGuyanaHaitiHeavily indebted poor countries (HIPC)High incomeHondurasHong Kong SAR, ChinaHungaryIBRD onlyIcelandIDA & IBRD totalIDA blendIDA onlyIDA totalIndiaIndonesiaIran, Islamic Rep.IraqIrelandIsraelItalyJamaicaJapanJordanKazakhstanKenyaKiribatiKorea, Dem. People’s Rep.Korea, Rep.KuwaitKyrgyz RepublicLao PDRLate-demographic dividendLatin America & Caribbean Latin America & Caribbean (excluding high income)Latin America & the Caribbean (IDA & IBRD countries)LatviaLeast developed countries: UN classificationLebanonLesothoLiberiaLibyaLithuaniaLow & middle incomeLow incomeLower middle incomeLuxembourgMacao SAR, ChinaMacedonia, FYRMadagascarMalawiMalaysiaMaldivesMaliMaltaMarshall IslandsMauritaniaMauritiusMexicoMicronesia, Fed. Sts.Middle East & North AfricaMiddle East & North Africa (excluding high income)Middle East & North Africa (IDA & IBRD countries)Middle incomeMoldovaMongoliaMoroccoMozambiqueMyanmarNamibiaNauruNepalNetherlandsNew CaledoniaNew ZealandNicaraguaNigerNigeriaNorth AmericaNorthern Mariana IslandsNorwayOECD membersOmanOther small statesPacific island small statesPakistanPalauPanamaPapua New GuineaParaguayPeruPhilippinesPolandPortugalPost-demographic dividendPre-demographic dividendPuerto RicoQatarRomaniaRussian FederationRwandaSamoaSao Tome and PrincipeSaudi ArabiaSenegalSerbiaSeychellesSierra LeoneSingaporeSlovak RepublicSloveniaSmall statesSolomon IslandsSomaliaSouth AfricaSouth AsiaSouth Asia (IDA & IBRD)SpainSri LankaSt. Kitts and NevisSt. LuciaSt. Vincent and the GrenadinesSub-Saharan Africa Sub-Saharan Africa (excluding high income)Sub-Saharan Africa (IDA & IBRD countries)SudanSurinameSwazilandSwedenSwitzerlandSyrian Arab RepublicTajikistanTanzaniaThailandTimor-LesteTogoTongaTrinidad and TobagoTunisiaTurkeyTurkmenistanTurks and Caicos IslandsTuvaluUgandaUkraineUnited Arab EmiratesUnited KingdomUnited StatesUpper middle incomeUruguayUzbekistanVanuatuVenezuela, RBVietnamVirgin Islands (U.S.)WorldYemen, Rep.ZambiaZimbabwe Timeline:
This timeline shows a graph from 1971 to 2009 of Canada. No data until 1970. Number of actual observations by date: 39.
Source name:
World Development Indicators
Source organization:
World Bank staff estimates from original source: European Commission, Joint Research Centre (JRC)/Netherlands Environmental Assessment Agency (PBL). Emission Database for Global Atmospheric Research (EDGAR): http://edgar.jrc.ec.europa.eu/.
Categories, topics:
Energy & Mining, Environment
Last updated:
apr 23, 2017
Indicators value changes by year
Minimum:
31.497
jan 1, 1982
Maximum:
48.349
jan 1, 1998
At the date of observation
Value
Absolute change
Change from previous value
jan 1, 1971
41.896
+41.896
0.0%
jan 1, 1972
40.984
-0.912
-2.18%
jan 1, 1973
43.18
+2.196
5.36%
jan 1, 1974
43.389
+0.209
0.48%
jan 1, 1975
40.234
-3.154
-7.27%
jan 1, 1976
37.114
-3.12
-7.76%
jan 1, 1977
33.925
-3.189
-8.59%
jan 1, 1978
35.206
+1.281
3.77%
jan 1, 1979
37.749
+2.543
7.22%
jan 1, 1980
34.981
-2.768
-7.33%
jan 1, 1981
32.625
-2.356
-6.73%
jan 1, 1982
31.497
-1.128
-3.46%
jan 1, 1983
35.971
+4.474
14.2%
jan 1, 1984
36.677
+0.706
1.96%
jan 1, 1985
42.381
+5.704
15.55%
jan 1, 1986
44.03
+1.649
3.89%
jan 1, 1987
43.546
-0.484
-1.1%
jan 1, 1988
43.882
+0.336
0.77%
jan 1, 1989
44.785
+0.903
2.06%
jan 1, 1990
36.706
-8.079
-18.04%
jan 1, 1991
43.15
+6.444
17.55%
jan 1, 1992
42.925
-0.225
-0.52%
jan 1, 1993
45.25
+2.325
5.42%
jan 1, 1994
44.005
-1.245
-2.75%
jan 1, 1995
39.413
-4.592
-10.44%
jan 1, 1996
39.674
+0.261
0.66%
jan 1, 1997
46.206
+6.531
16.46%
jan 1, 1998
48.349
+2.143
4.64%
jan 1, 1999
40.7
-7.649
-15.82%
jan 1, 2000
44.688
+3.988
9.8%
jan 1, 2001
47.492
+2.804
6.28%
jan 1, 2002
47.859
+0.367
0.77%
jan 1, 2003
45.355
-2.505
-5.23%
jan 1, 2004
43.61
-1.745
-3.85%
jan 1, 2005
42.832
-0.778
-1.78%
jan 1, 2006
44.154
+1.323
3.09%
jan 1, 2007
44.249
+0.094
0.21%
jan 1, 2008
43.295
-0.953
-2.15%
jan 1, 2009
42.106
-1.189
-2.75%
Ranking of countries by current statistics by years


Comments: