29
/
en
AIzaSyAYiBZKx7MnpbEhh9jyipgxe19OcubqV5w
April 1, 2024
260804
Tanzania
TZA
true
2
1
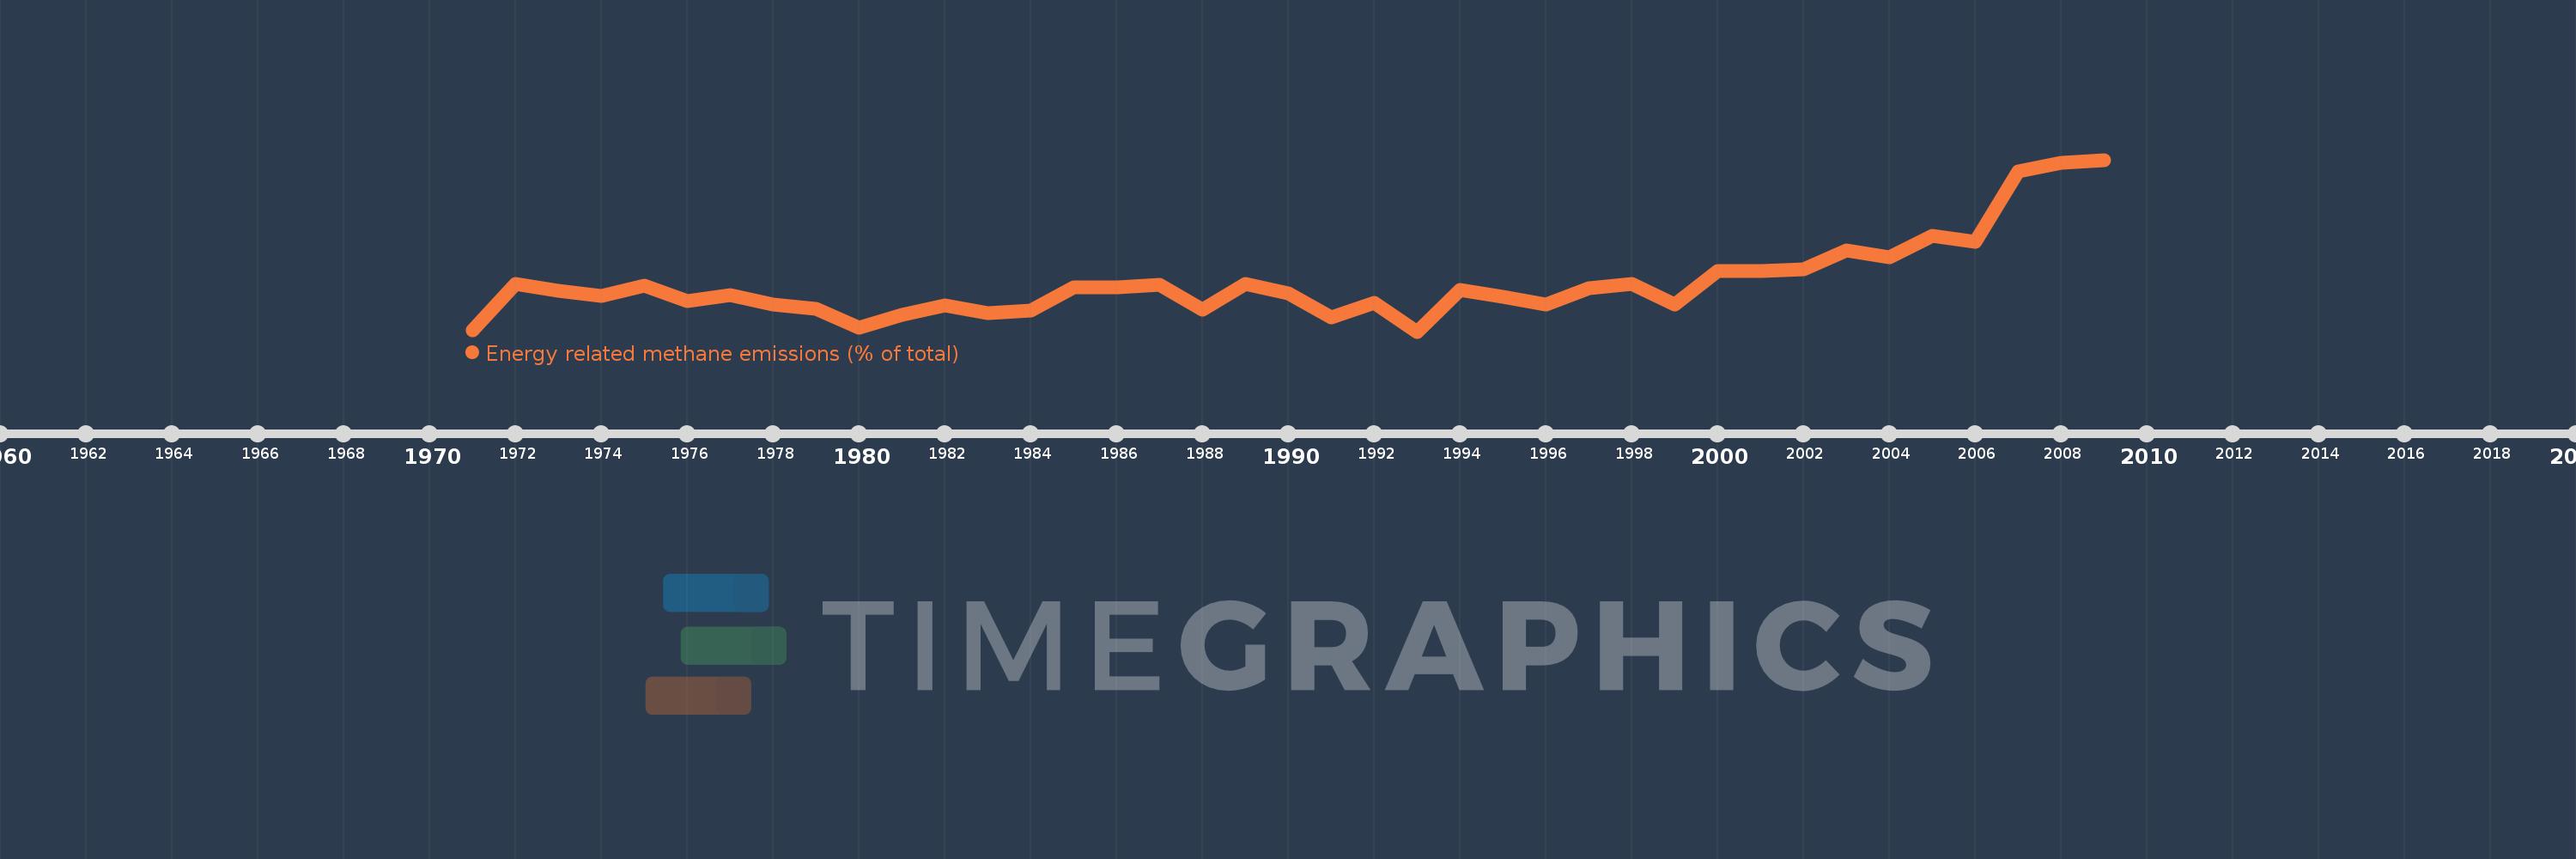
Energy related methane emissions (% of total)
2009,2008,2007,2006,2005,2004,2003,2002,2001,2000,1999,1998,1997,1996,1995,1994,1993,1992,1991,1990,1989,1988,1987,1986,1985,1984,1983,1982,1981,1980,1979,1978,1977,1976,1975,1974,1973,1972,1971
This statistics in other country:
AfghanistanAlbaniaAlgeriaAmerican SamoaAngolaAntigua and BarbudaArab WorldArgentinaArmeniaArubaAustraliaAustriaAzerbaijanBahamas, TheBahrainBangladeshBarbadosBelarusBelgiumBelizeBeninBermudaBhutanBoliviaBosnia and HerzegovinaBotswanaBrazilBritish Virgin IslandsBrunei DarussalamBulgariaBurkina FasoBurundiCabo VerdeCambodiaCameroonCanadaCaribbean small statesCayman IslandsCentral African RepublicCentral Europe and the BalticsChadChileChinaColombiaComorosCongo, Dem. Rep.Congo, Rep.Costa RicaCote d'IvoireCroatiaCubaCyprusCzech RepublicDenmarkDjiboutiDominicaDominican RepublicEarly-demographic dividendEast Asia & PacificEast Asia & Pacific (excluding high income)East Asia & Pacific (IDA & IBRD countries)EcuadorEgypt, Arab Rep.El SalvadorEquatorial GuineaEritreaEstoniaEthiopiaEuro areaEurope & Central AsiaEurope & Central Asia (excluding high income)Europe & Central Asia (IDA & IBRD countries)European UnionFaroe IslandsFijiFinlandFragile and conflict affected situationsFranceFrench PolynesiaGabonGambia, TheGeorgiaGermanyGhanaGibraltarGreeceGreenlandGrenadaGuamGuatemalaGuineaGuinea-BissauGuyanaHaitiHeavily indebted poor countries (HIPC)High incomeHondurasHong Kong SAR, ChinaHungaryIBRD onlyIcelandIDA & IBRD totalIDA blendIDA onlyIDA totalIndiaIndonesiaIran, Islamic Rep.IraqIrelandIsraelItalyJamaicaJapanJordanKazakhstanKenyaKiribatiKorea, Dem. People’s Rep.Korea, Rep.KuwaitKyrgyz RepublicLao PDRLate-demographic dividendLatin America & Caribbean Latin America & Caribbean (excluding high income)Latin America & the Caribbean (IDA & IBRD countries)LatviaLeast developed countries: UN classificationLebanonLesothoLiberiaLibyaLithuaniaLow & middle incomeLow incomeLower middle incomeLuxembourgMacao SAR, ChinaMacedonia, FYRMadagascarMalawiMalaysiaMaldivesMaliMaltaMarshall IslandsMauritaniaMauritiusMexicoMicronesia, Fed. Sts.Middle East & North AfricaMiddle East & North Africa (excluding high income)Middle East & North Africa (IDA & IBRD countries)Middle incomeMoldovaMongoliaMoroccoMozambiqueMyanmarNamibiaNauruNepalNetherlandsNew CaledoniaNew ZealandNicaraguaNigerNigeriaNorth AmericaNorthern Mariana IslandsNorwayOECD membersOmanOther small statesPacific island small statesPakistanPalauPanamaPapua New GuineaParaguayPeruPhilippinesPolandPortugalPost-demographic dividendPre-demographic dividendPuerto RicoQatarRomaniaRussian FederationRwandaSamoaSao Tome and PrincipeSaudi ArabiaSenegalSerbiaSeychellesSierra LeoneSingaporeSlovak RepublicSloveniaSmall statesSolomon IslandsSomaliaSouth AfricaSouth AsiaSouth Asia (IDA & IBRD)SpainSri LankaSt. Kitts and NevisSt. LuciaSt. Vincent and the GrenadinesSub-Saharan Africa Sub-Saharan Africa (excluding high income)Sub-Saharan Africa (IDA & IBRD countries)SudanSurinameSwazilandSwedenSwitzerlandSyrian Arab RepublicTajikistanTanzaniaThailandTimor-LesteTogoTongaTrinidad and TobagoTunisiaTurkeyTurkmenistanTurks and Caicos IslandsTuvaluUgandaUkraineUnited Arab EmiratesUnited KingdomUnited StatesUpper middle incomeUruguayUzbekistanVanuatuVenezuela, RBVietnamVirgin Islands (U.S.)WorldYemen, Rep.ZambiaZimbabwe Timeline:
This timeline shows a graph from 1971 to 2009 of Tanzania. No data until 1970. Number of actual observations by date: 39.
Source name:
World Development Indicators
Source organization:
World Bank staff estimates from original source: European Commission, Joint Research Centre (JRC)/Netherlands Environmental Assessment Agency (PBL). Emission Database for Global Atmospheric Research (EDGAR): http://edgar.jrc.ec.europa.eu/.
Categories, topics:
Energy & Mining, Environment
Last updated:
apr 23, 2017
Indicators value changes by year
Maximum:
22.243
jan 1, 2009
At the date of observation
Value
Absolute change
Change from previous value
jan 1, 1971
7.777
+7.777
0.0%
jan 1, 1972
11.733
+3.956
50.87%
jan 1, 1973
11.119
-0.614
-5.24%
jan 1, 1974
10.651
-0.467
-4.2%
jan 1, 1975
11.549
+0.897
8.42%
jan 1, 1976
10.248
-1.301
-11.26%
jan 1, 1977
10.761
+0.514
5.01%
jan 1, 1978
9.922
-0.839
-7.8%
jan 1, 1979
9.569
-0.353
-3.56%
jan 1, 1980
7.976
-1.593
-16.65%
jan 1, 1981
9.097
+1.12
14.05%
jan 1, 1982
9.91
+0.813
8.94%
jan 1, 1983
9.198
-0.712
-7.18%
jan 1, 1984
9.427
+0.229
2.49%
jan 1, 1985
11.44
+2.014
21.36%
jan 1, 1986
11.422
-0.019
-0.16%
jan 1, 1987
11.597
+0.175
1.53%
jan 1, 1988
9.477
-2.12
-18.28%
jan 1, 1989
11.666
+2.189
23.1%
jan 1, 1990
10.888
-0.778
-6.67%
jan 1, 1991
8.854
-2.034
-18.68%
jan 1, 1992
10.115
+1.261
14.24%
jan 1, 1993
7.652
-2.462
-24.34%
jan 1, 1994
11.225
+3.573
46.69%
jan 1, 1995
10.641
-0.584
-5.2%
jan 1, 1996
9.947
-0.694
-6.52%
jan 1, 1997
11.369
+1.422
14.29%
jan 1, 1998
11.707
+0.337
2.97%
jan 1, 1999
9.96
-1.747
-14.92%
jan 1, 2000
12.779
+2.819
28.31%
jan 1, 2001
12.761
-0.018
-0.14%
jan 1, 2002
12.957
+0.195
1.53%
jan 1, 2003
14.532
+1.575
12.16%
jan 1, 2004
13.966
-0.565
-3.89%
jan 1, 2005
15.773
+1.807
12.94%
jan 1, 2006
15.302
-0.471
-2.99%
jan 1, 2007
21.265
+5.963
38.97%
jan 1, 2008
21.998
+0.734
3.45%
jan 1, 2009
22.243
+0.244
1.11%
Ranking of countries by current statistics by years


Comments: