29
/
en
AIzaSyAYiBZKx7MnpbEhh9jyipgxe19OcubqV5w
April 1, 2024
232157
Samoa
WSM
true
2
1
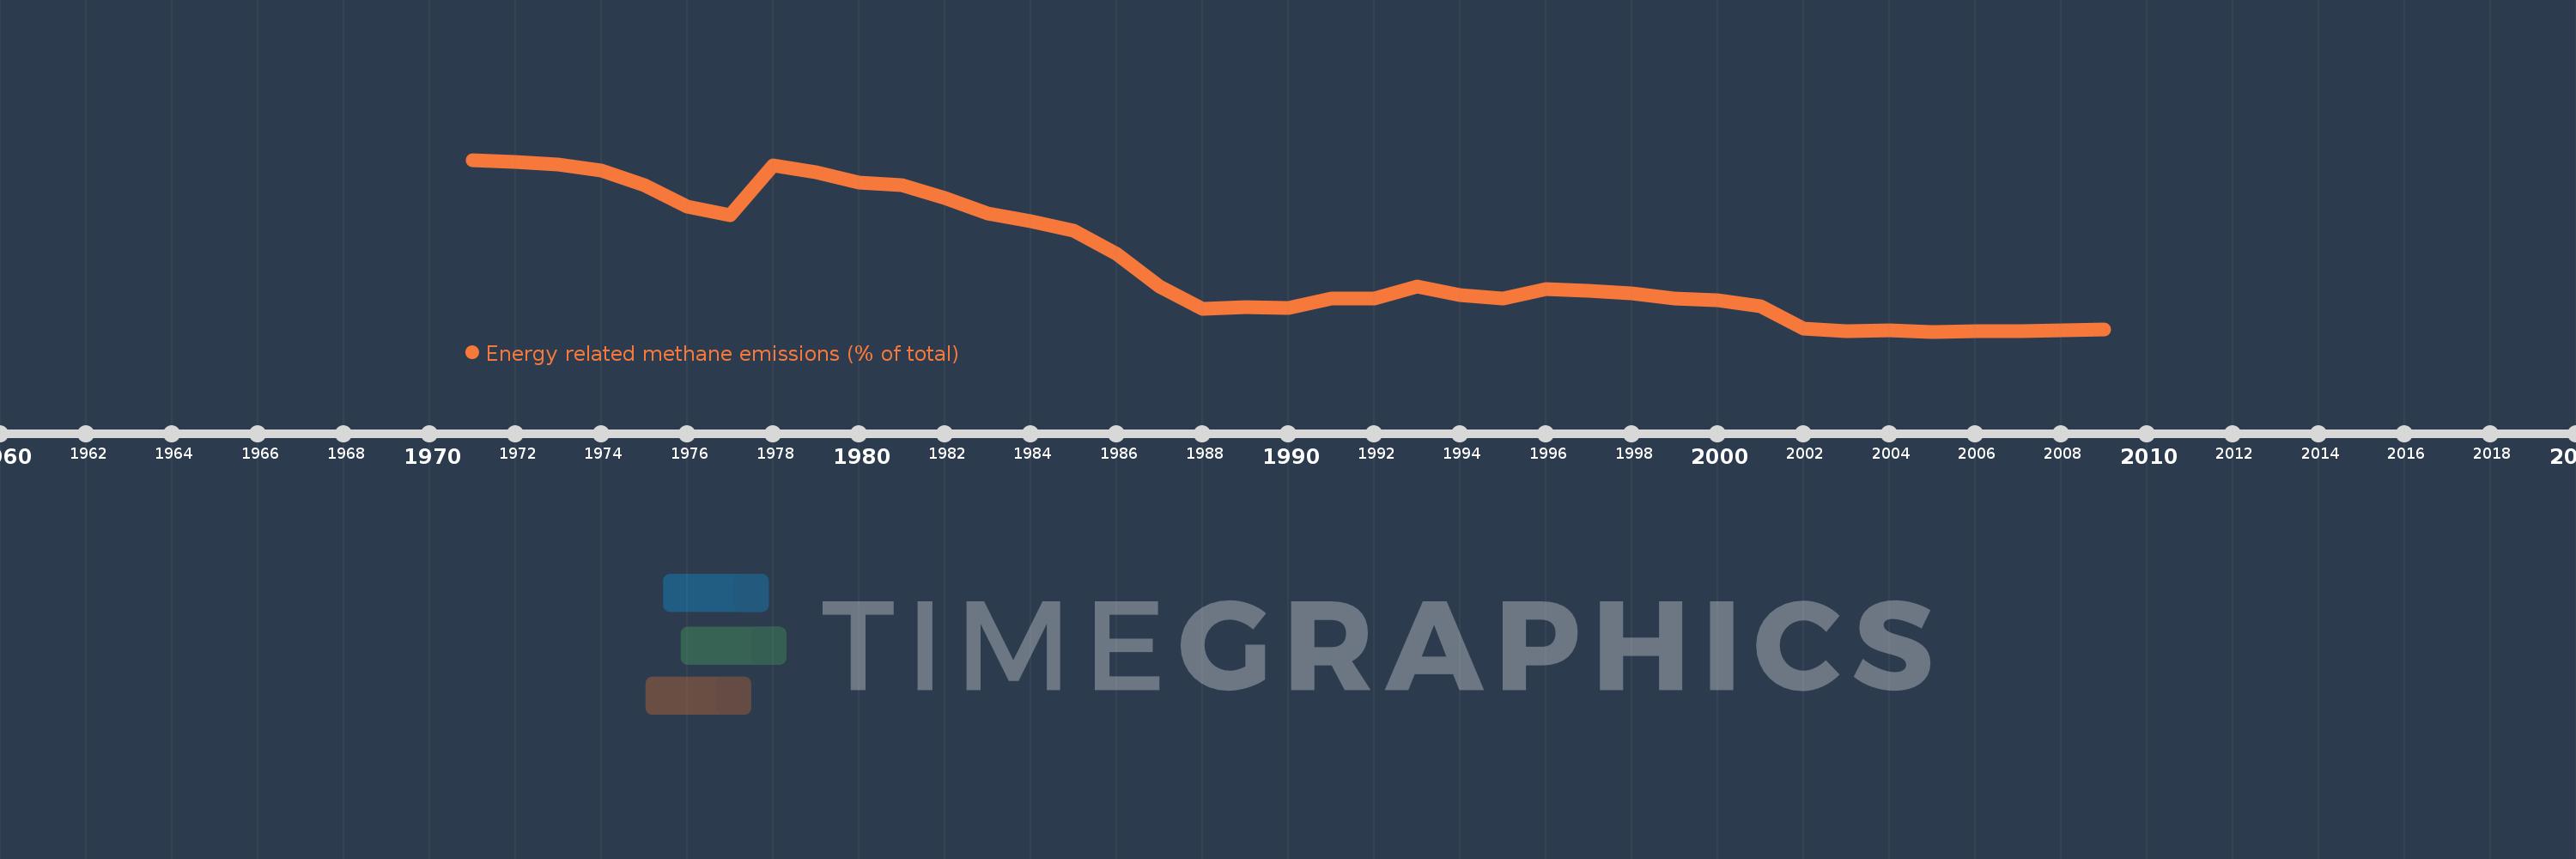
Energy related methane emissions (% of total)
2009,2008,2007,2006,2005,2004,2003,2002,2001,2000,1999,1998,1997,1996,1995,1994,1993,1992,1991,1990,1989,1988,1987,1986,1985,1984,1983,1982,1981,1980,1979,1978,1977,1976,1975,1974,1973,1972,1971
This statistics in other country:
AfghanistanAlbaniaAlgeriaAmerican SamoaAngolaAntigua and BarbudaArab WorldArgentinaArmeniaArubaAustraliaAustriaAzerbaijanBahamas, TheBahrainBangladeshBarbadosBelarusBelgiumBelizeBeninBermudaBhutanBoliviaBosnia and HerzegovinaBotswanaBrazilBritish Virgin IslandsBrunei DarussalamBulgariaBurkina FasoBurundiCabo VerdeCambodiaCameroonCanadaCaribbean small statesCayman IslandsCentral African RepublicCentral Europe and the BalticsChadChileChinaColombiaComorosCongo, Dem. Rep.Congo, Rep.Costa RicaCote d'IvoireCroatiaCubaCyprusCzech RepublicDenmarkDjiboutiDominicaDominican RepublicEarly-demographic dividendEast Asia & PacificEast Asia & Pacific (excluding high income)East Asia & Pacific (IDA & IBRD countries)EcuadorEgypt, Arab Rep.El SalvadorEquatorial GuineaEritreaEstoniaEthiopiaEuro areaEurope & Central AsiaEurope & Central Asia (excluding high income)Europe & Central Asia (IDA & IBRD countries)European UnionFaroe IslandsFijiFinlandFragile and conflict affected situationsFranceFrench PolynesiaGabonGambia, TheGeorgiaGermanyGhanaGibraltarGreeceGreenlandGrenadaGuamGuatemalaGuineaGuinea-BissauGuyanaHaitiHeavily indebted poor countries (HIPC)High incomeHondurasHong Kong SAR, ChinaHungaryIBRD onlyIcelandIDA & IBRD totalIDA blendIDA onlyIDA totalIndiaIndonesiaIran, Islamic Rep.IraqIrelandIsraelItalyJamaicaJapanJordanKazakhstanKenyaKiribatiKorea, Dem. People’s Rep.Korea, Rep.KuwaitKyrgyz RepublicLao PDRLate-demographic dividendLatin America & Caribbean Latin America & Caribbean (excluding high income)Latin America & the Caribbean (IDA & IBRD countries)LatviaLeast developed countries: UN classificationLebanonLesothoLiberiaLibyaLithuaniaLow & middle incomeLow incomeLower middle incomeLuxembourgMacao SAR, ChinaMacedonia, FYRMadagascarMalawiMalaysiaMaldivesMaliMaltaMarshall IslandsMauritaniaMauritiusMexicoMicronesia, Fed. Sts.Middle East & North AfricaMiddle East & North Africa (excluding high income)Middle East & North Africa (IDA & IBRD countries)Middle incomeMoldovaMongoliaMoroccoMozambiqueMyanmarNamibiaNauruNepalNetherlandsNew CaledoniaNew ZealandNicaraguaNigerNigeriaNorth AmericaNorthern Mariana IslandsNorwayOECD membersOmanOther small statesPacific island small statesPakistanPalauPanamaPapua New GuineaParaguayPeruPhilippinesPolandPortugalPost-demographic dividendPre-demographic dividendPuerto RicoQatarRomaniaRussian FederationRwandaSamoaSao Tome and PrincipeSaudi ArabiaSenegalSerbiaSeychellesSierra LeoneSingaporeSlovak RepublicSloveniaSmall statesSolomon IslandsSomaliaSouth AfricaSouth AsiaSouth Asia (IDA & IBRD)SpainSri LankaSt. Kitts and NevisSt. LuciaSt. Vincent and the GrenadinesSub-Saharan Africa Sub-Saharan Africa (excluding high income)Sub-Saharan Africa (IDA & IBRD countries)SudanSurinameSwazilandSwedenSwitzerlandSyrian Arab RepublicTajikistanTanzaniaThailandTimor-LesteTogoTongaTrinidad and TobagoTunisiaTurkeyTurkmenistanTurks and Caicos IslandsTuvaluUgandaUkraineUnited Arab EmiratesUnited KingdomUnited StatesUpper middle incomeUruguayUzbekistanVanuatuVenezuela, RBVietnamVirgin Islands (U.S.)WorldYemen, Rep.ZambiaZimbabwe Timeline:
This timeline shows a graph from 1971 to 2009 of Samoa. No data until 1970. Number of actual observations by date: 39.
Source name:
World Development Indicators
Source organization:
World Bank staff estimates from original source: European Commission, Joint Research Centre (JRC)/Netherlands Environmental Assessment Agency (PBL). Emission Database for Global Atmospheric Research (EDGAR): http://edgar.jrc.ec.europa.eu/.
Categories, topics:
Energy & Mining, Environment
Last updated:
apr 23, 2017
Indicators value changes by year
At the date of observation
Value
Absolute change
Change from previous value
jan 1, 1971
8.109
+8.109
0.0%
jan 1, 1972
8.075
-0.034
-0.42%
jan 1, 1973
8.018
-0.057
-0.71%
jan 1, 1974
7.912
-0.106
-1.33%
jan 1, 1975
7.647
-0.265
-3.35%
jan 1, 1976
7.272
-0.374
-4.9%
jan 1, 1977
7.118
-0.154
-2.12%
jan 1, 1978
8.014
+0.895
12.58%
jan 1, 1979
7.889
-0.125
-1.56%
jan 1, 1980
7.702
-0.187
-2.37%
jan 1, 1981
7.659
-0.043
-0.56%
jan 1, 1982
7.43
-0.228
-2.98%
jan 1, 1983
7.139
-0.291
-3.92%
jan 1, 1984
7.006
-0.133
-1.86%
jan 1, 1985
6.84
-0.167
-2.38%
jan 1, 1986
6.423
-0.417
-6.09%
jan 1, 1987
5.833
-0.589
-9.18%
jan 1, 1988
5.436
-0.398
-6.82%
jan 1, 1989
5.467
+0.031
0.58%
jan 1, 1990
5.443
-0.024
-0.45%
jan 1, 1991
5.611
+0.169
3.1%
jan 1, 1992
5.612
+0.001
0.02%
jan 1, 1993
5.835
+0.223
3.97%
jan 1, 1994
5.687
-0.148
-2.54%
jan 1, 1995
5.614
-0.073
-1.29%
jan 1, 1996
5.793
+0.178
3.18%
jan 1, 1997
5.751
-0.041
-0.71%
jan 1, 1998
5.709
-0.042
-0.73%
jan 1, 1999
5.618
-0.092
-1.61%
jan 1, 2000
5.583
-0.035
-0.62%
jan 1, 2001
5.482
-0.101
-1.82%
jan 1, 2002
5.072
-0.409
-7.47%
jan 1, 2003
5.038
-0.035
-0.68%
jan 1, 2004
5.041
+0.003
0.06%
jan 1, 2005
5.025
-0.016
-0.32%
jan 1, 2006
5.033
+0.009
0.17%
jan 1, 2007
5.027
-0.007
-0.13%
jan 1, 2008
5.049
+0.022
0.44%
jan 1, 2009
5.066
+0.018
0.35%
Ranking of countries by current statistics by years


Comments: