29
/
en
AIzaSyAYiBZKx7MnpbEhh9jyipgxe19OcubqV5w
April 1, 2024
42312
Latin America & Caribbean (excluding high income)
LAC
false
2
1
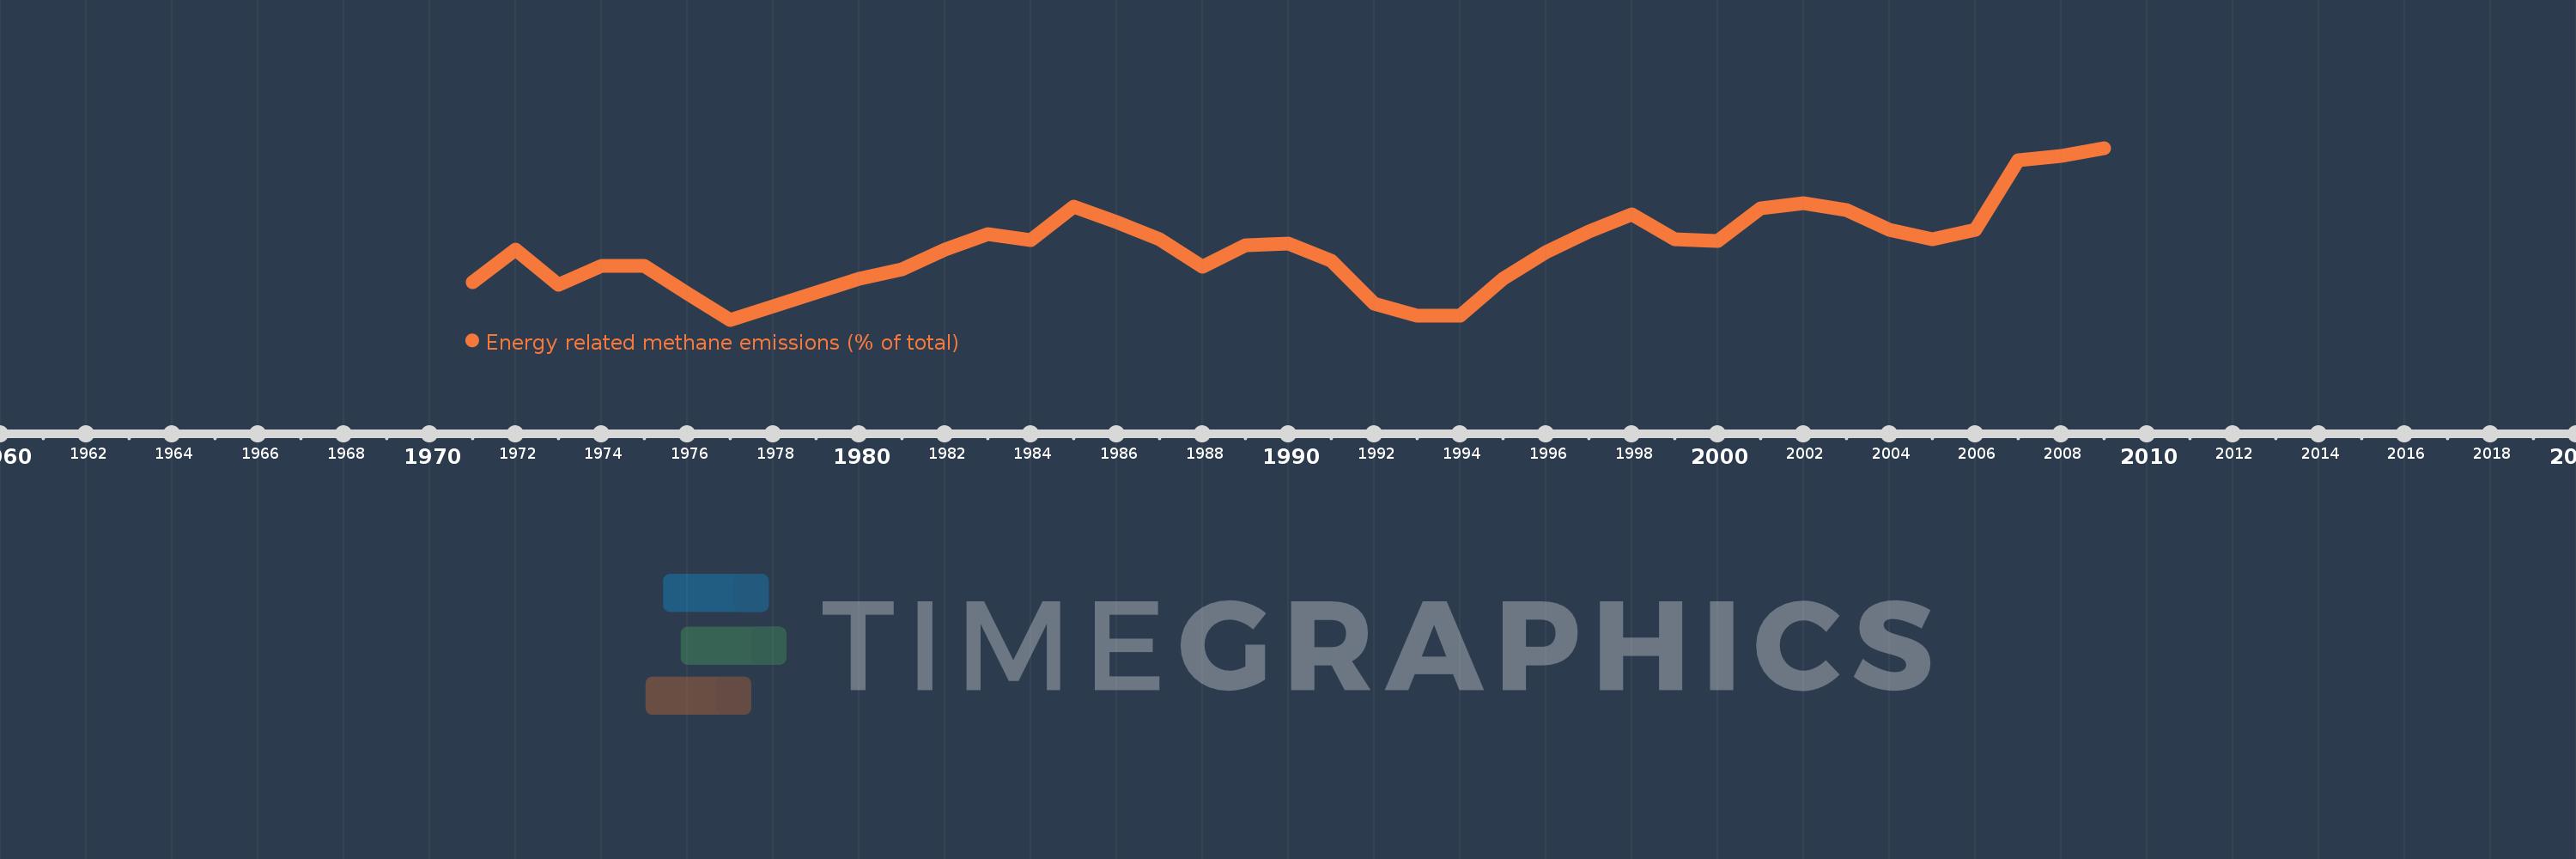
Energy related methane emissions (% of total)
2009,2008,2007,2006,2005,2004,2003,2002,2001,2000,1999,1998,1997,1996,1995,1994,1993,1992,1991,1990,1989,1988,1987,1986,1985,1984,1983,1982,1981,1980,1979,1978,1977,1976,1975,1974,1973,1972,1971
This statistics in other country:
AfghanistanAlbaniaAlgeriaAmerican SamoaAngolaAntigua and BarbudaArab WorldArgentinaArmeniaArubaAustraliaAustriaAzerbaijanBahamas, TheBahrainBangladeshBarbadosBelarusBelgiumBelizeBeninBermudaBhutanBoliviaBosnia and HerzegovinaBotswanaBrazilBritish Virgin IslandsBrunei DarussalamBulgariaBurkina FasoBurundiCabo VerdeCambodiaCameroonCanadaCaribbean small statesCayman IslandsCentral African RepublicCentral Europe and the BalticsChadChileChinaColombiaComorosCongo, Dem. Rep.Congo, Rep.Costa RicaCote d'IvoireCroatiaCubaCyprusCzech RepublicDenmarkDjiboutiDominicaDominican RepublicEarly-demographic dividendEast Asia & PacificEast Asia & Pacific (excluding high income)East Asia & Pacific (IDA & IBRD countries)EcuadorEgypt, Arab Rep.El SalvadorEquatorial GuineaEritreaEstoniaEthiopiaEuro areaEurope & Central AsiaEurope & Central Asia (excluding high income)Europe & Central Asia (IDA & IBRD countries)European UnionFaroe IslandsFijiFinlandFragile and conflict affected situationsFranceFrench PolynesiaGabonGambia, TheGeorgiaGermanyGhanaGibraltarGreeceGreenlandGrenadaGuamGuatemalaGuineaGuinea-BissauGuyanaHaitiHeavily indebted poor countries (HIPC)High incomeHondurasHong Kong SAR, ChinaHungaryIBRD onlyIcelandIDA & IBRD totalIDA blendIDA onlyIDA totalIndiaIndonesiaIran, Islamic Rep.IraqIrelandIsraelItalyJamaicaJapanJordanKazakhstanKenyaKiribatiKorea, Dem. People’s Rep.Korea, Rep.KuwaitKyrgyz RepublicLao PDRLate-demographic dividendLatin America & Caribbean Latin America & Caribbean (excluding high income)Latin America & the Caribbean (IDA & IBRD countries)LatviaLeast developed countries: UN classificationLebanonLesothoLiberiaLibyaLithuaniaLow & middle incomeLow incomeLower middle incomeLuxembourgMacao SAR, ChinaMacedonia, FYRMadagascarMalawiMalaysiaMaldivesMaliMaltaMarshall IslandsMauritaniaMauritiusMexicoMicronesia, Fed. Sts.Middle East & North AfricaMiddle East & North Africa (excluding high income)Middle East & North Africa (IDA & IBRD countries)Middle incomeMoldovaMongoliaMoroccoMozambiqueMyanmarNamibiaNauruNepalNetherlandsNew CaledoniaNew ZealandNicaraguaNigerNigeriaNorth AmericaNorthern Mariana IslandsNorwayOECD membersOmanOther small statesPacific island small statesPakistanPalauPanamaPapua New GuineaParaguayPeruPhilippinesPolandPortugalPost-demographic dividendPre-demographic dividendPuerto RicoQatarRomaniaRussian FederationRwandaSamoaSao Tome and PrincipeSaudi ArabiaSenegalSerbiaSeychellesSierra LeoneSingaporeSlovak RepublicSloveniaSmall statesSolomon IslandsSomaliaSouth AfricaSouth AsiaSouth Asia (IDA & IBRD)SpainSri LankaSt. Kitts and NevisSt. LuciaSt. Vincent and the GrenadinesSub-Saharan Africa Sub-Saharan Africa (excluding high income)Sub-Saharan Africa (IDA & IBRD countries)SudanSurinameSwazilandSwedenSwitzerlandSyrian Arab RepublicTajikistanTanzaniaThailandTimor-LesteTogoTongaTrinidad and TobagoTunisiaTurkeyTurkmenistanTurks and Caicos IslandsTuvaluUgandaUkraineUnited Arab EmiratesUnited KingdomUnited StatesUpper middle incomeUruguayUzbekistanVanuatuVenezuela, RBVietnamVirgin Islands (U.S.)WorldYemen, Rep.ZambiaZimbabwe Timeline:
This timeline shows a graph from 1971 to 2009 of Latin America & Caribbean (excluding high income). No data until 1970. Number of actual observations by date: 39.
Source name:
World Development Indicators
Source organization:
World Bank staff estimates from original source: European Commission, Joint Research Centre (JRC)/Netherlands Environmental Assessment Agency (PBL). Emission Database for Global Atmospheric Research (EDGAR): http://edgar.jrc.ec.europa.eu/.
Categories, topics:
Energy & Mining, Environment
Last updated:
apr 23, 2017
Indicators value changes by year
Minimum:
12.977
jan 1, 1977
Maximum:
18.059
jan 1, 2009
At the date of observation
Value
Absolute change
Change from previous value
jan 1, 1971
14.077
+14.077
0.0%
jan 1, 1972
15.063
+0.987
7.01%
jan 1, 1973
14.008
-1.056
-7.01%
jan 1, 1974
14.568
+0.56
4.0%
jan 1, 1975
14.558
-0.01
-0.07%
jan 1, 1976
13.75
-0.807
-5.55%
jan 1, 1977
12.977
-0.774
-5.63%
jan 1, 1978
13.368
+0.392
3.02%
jan 1, 1979
13.785
+0.417
3.12%
jan 1, 1980
14.184
+0.399
2.9%
jan 1, 1981
14.46
+0.276
1.94%
jan 1, 1982
15.056
+0.596
4.12%
jan 1, 1983
15.501
+0.446
2.96%
jan 1, 1984
15.327
-0.175
-1.13%
jan 1, 1985
16.32
+0.994
6.48%
jan 1, 1986
15.876
-0.444
-2.72%
jan 1, 1987
15.349
-0.527
-3.32%
jan 1, 1988
14.554
-0.795
-5.18%
jan 1, 1989
15.172
+0.618
4.25%
jan 1, 1990
15.236
+0.064
0.42%
jan 1, 1991
14.724
-0.513
-3.36%
jan 1, 1992
13.44
-1.283
-8.72%
jan 1, 1993
13.096
-0.344
-2.56%
jan 1, 1994
13.107
+0.01
0.08%
jan 1, 1995
14.182
+1.075
8.2%
jan 1, 1996
14.982
+0.8
5.64%
jan 1, 1997
15.574
+0.592
3.95%
jan 1, 1998
16.092
+0.518
3.33%
jan 1, 1999
15.357
-0.735
-4.57%
jan 1, 2000
15.313
-0.044
-0.29%
jan 1, 2001
16.269
+0.956
6.24%
jan 1, 2002
16.418
+0.149
0.92%
jan 1, 2003
16.22
-0.198
-1.21%
jan 1, 2004
15.644
-0.576
-3.55%
jan 1, 2005
15.36
-0.284
-1.81%
jan 1, 2006
15.633
+0.273
1.77%
jan 1, 2007
17.692
+2.059
13.17%
jan 1, 2008
17.83
+0.138
0.78%
jan 1, 2009
18.059
+0.228
1.28%
Ranking of countries by current statistics by years


Comments: