29
/
en
AIzaSyAYiBZKx7MnpbEhh9jyipgxe19OcubqV5w
April 1, 2024
137930
Georgia
GEO
true
2
1
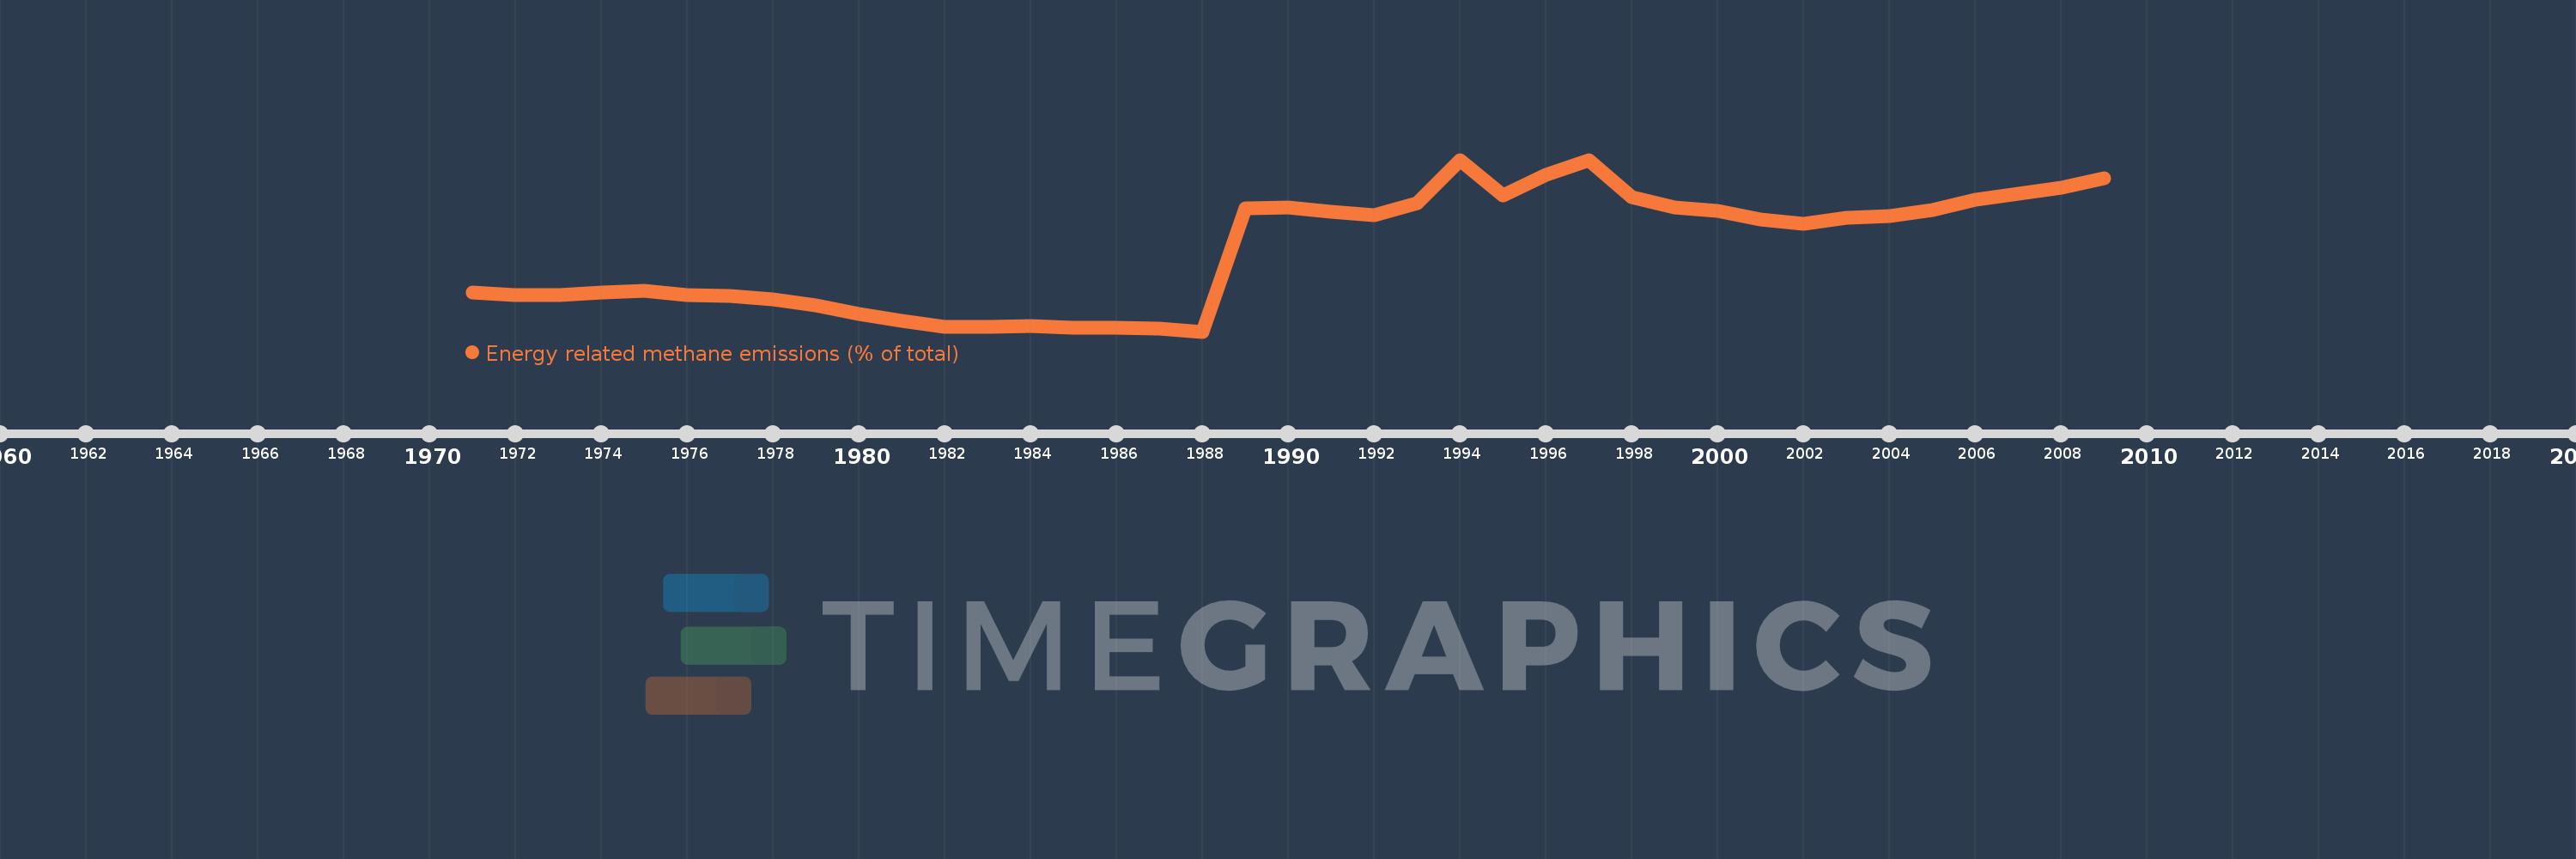
Energy related methane emissions (% of total)
2009,2008,2007,2006,2005,2004,2003,2002,2001,2000,1999,1998,1997,1996,1995,1994,1993,1992,1991,1990,1989,1988,1987,1986,1985,1984,1983,1982,1981,1980,1979,1978,1977,1976,1975,1974,1973,1972,1971
This statistics in other country:
AfghanistanAlbaniaAlgeriaAmerican SamoaAngolaAntigua and BarbudaArab WorldArgentinaArmeniaArubaAustraliaAustriaAzerbaijanBahamas, TheBahrainBangladeshBarbadosBelarusBelgiumBelizeBeninBermudaBhutanBoliviaBosnia and HerzegovinaBotswanaBrazilBritish Virgin IslandsBrunei DarussalamBulgariaBurkina FasoBurundiCabo VerdeCambodiaCameroonCanadaCaribbean small statesCayman IslandsCentral African RepublicCentral Europe and the BalticsChadChileChinaColombiaComorosCongo, Dem. Rep.Congo, Rep.Costa RicaCote d'IvoireCroatiaCubaCyprusCzech RepublicDenmarkDjiboutiDominicaDominican RepublicEarly-demographic dividendEast Asia & PacificEast Asia & Pacific (excluding high income)East Asia & Pacific (IDA & IBRD countries)EcuadorEgypt, Arab Rep.El SalvadorEquatorial GuineaEritreaEstoniaEthiopiaEuro areaEurope & Central AsiaEurope & Central Asia (excluding high income)Europe & Central Asia (IDA & IBRD countries)European UnionFaroe IslandsFijiFinlandFragile and conflict affected situationsFranceFrench PolynesiaGabonGambia, TheGeorgiaGermanyGhanaGibraltarGreeceGreenlandGrenadaGuamGuatemalaGuineaGuinea-BissauGuyanaHaitiHeavily indebted poor countries (HIPC)High incomeHondurasHong Kong SAR, ChinaHungaryIBRD onlyIcelandIDA & IBRD totalIDA blendIDA onlyIDA totalIndiaIndonesiaIran, Islamic Rep.IraqIrelandIsraelItalyJamaicaJapanJordanKazakhstanKenyaKiribatiKorea, Dem. People’s Rep.Korea, Rep.KuwaitKyrgyz RepublicLao PDRLate-demographic dividendLatin America & Caribbean Latin America & Caribbean (excluding high income)Latin America & the Caribbean (IDA & IBRD countries)LatviaLeast developed countries: UN classificationLebanonLesothoLiberiaLibyaLithuaniaLow & middle incomeLow incomeLower middle incomeLuxembourgMacao SAR, ChinaMacedonia, FYRMadagascarMalawiMalaysiaMaldivesMaliMaltaMarshall IslandsMauritaniaMauritiusMexicoMicronesia, Fed. Sts.Middle East & North AfricaMiddle East & North Africa (excluding high income)Middle East & North Africa (IDA & IBRD countries)Middle incomeMoldovaMongoliaMoroccoMozambiqueMyanmarNamibiaNauruNepalNetherlandsNew CaledoniaNew ZealandNicaraguaNigerNigeriaNorth AmericaNorthern Mariana IslandsNorwayOECD membersOmanOther small statesPacific island small statesPakistanPalauPanamaPapua New GuineaParaguayPeruPhilippinesPolandPortugalPost-demographic dividendPre-demographic dividendPuerto RicoQatarRomaniaRussian FederationRwandaSamoaSao Tome and PrincipeSaudi ArabiaSenegalSerbiaSeychellesSierra LeoneSingaporeSlovak RepublicSloveniaSmall statesSolomon IslandsSomaliaSouth AfricaSouth AsiaSouth Asia (IDA & IBRD)SpainSri LankaSt. Kitts and NevisSt. LuciaSt. Vincent and the GrenadinesSub-Saharan Africa Sub-Saharan Africa (excluding high income)Sub-Saharan Africa (IDA & IBRD countries)SudanSurinameSwazilandSwedenSwitzerlandSyrian Arab RepublicTajikistanTanzaniaThailandTimor-LesteTogoTongaTrinidad and TobagoTunisiaTurkeyTurkmenistanTurks and Caicos IslandsTuvaluUgandaUkraineUnited Arab EmiratesUnited KingdomUnited StatesUpper middle incomeUruguayUzbekistanVanuatuVenezuela, RBVietnamVirgin Islands (U.S.)WorldYemen, Rep.ZambiaZimbabwe Timeline:
This timeline shows a graph from 1971 to 2009 of Georgia. No data until 1970. Number of actual observations by date: 39.
Source name:
World Development Indicators
Source organization:
World Bank staff estimates from original source: European Commission, Joint Research Centre (JRC)/Netherlands Environmental Assessment Agency (PBL). Emission Database for Global Atmospheric Research (EDGAR): http://edgar.jrc.ec.europa.eu/.
Categories, topics:
Energy & Mining, Environment
Last updated:
apr 23, 2017
Indicators value changes by year
Minimum:
17.268
jan 1, 1988
Maximum:
41.845
jan 1, 1994
At the date of observation
Value
Absolute change
Change from previous value
jan 1, 1971
22.862
+22.862
0.0%
jan 1, 1972
22.472
-0.39
-1.7%
jan 1, 1973
22.442
-0.031
-0.14%
jan 1, 1974
22.828
+0.387
1.72%
jan 1, 1975
23.085
+0.257
1.13%
jan 1, 1976
22.52
-0.566
-2.45%
jan 1, 1977
22.382
-0.137
-0.61%
jan 1, 1978
21.909
-0.473
-2.11%
jan 1, 1979
20.996
-0.914
-4.17%
jan 1, 1980
19.828
-1.167
-5.56%
jan 1, 1981
18.851
-0.978
-4.93%
jan 1, 1982
17.996
-0.855
-4.53%
jan 1, 1983
17.959
-0.038
-0.21%
jan 1, 1984
18.109
+0.15
0.84%
jan 1, 1985
17.786
-0.323
-1.78%
jan 1, 1986
17.777
-0.009
-0.05%
jan 1, 1987
17.733
-0.043
-0.24%
jan 1, 1988
17.268
-0.466
-2.63%
jan 1, 1989
34.933
+17.665
102.3%
jan 1, 1990
34.979
+0.046
0.13%
jan 1, 1991
34.454
-0.525
-1.5%
jan 1, 1992
33.913
-0.541
-1.57%
jan 1, 1993
35.67
+1.757
5.18%
jan 1, 1994
41.845
+6.175
17.31%
jan 1, 1995
36.718
-5.127
-12.25%
jan 1, 1996
39.723
+3.005
8.18%
jan 1, 1997
41.754
+2.031
5.11%
jan 1, 1998
36.521
-5.233
-12.53%
jan 1, 1999
35.025
-1.496
-4.1%
jan 1, 2000
34.518
-0.507
-1.45%
jan 1, 2001
33.283
-1.235
-3.58%
jan 1, 2002
32.654
-0.629
-1.89%
jan 1, 2003
33.555
+0.902
2.76%
jan 1, 2004
33.787
+0.232
0.69%
jan 1, 2005
34.642
+0.855
2.53%
jan 1, 2006
36.13
+1.488
4.3%
jan 1, 2007
36.968
+0.838
2.32%
jan 1, 2008
37.893
+0.925
2.5%
jan 1, 2009
39.182
+1.289
3.4%
Ranking of countries by current statistics by years


Comments: