29
/
en
AIzaSyAYiBZKx7MnpbEhh9jyipgxe19OcubqV5w
April 1, 2024
54967
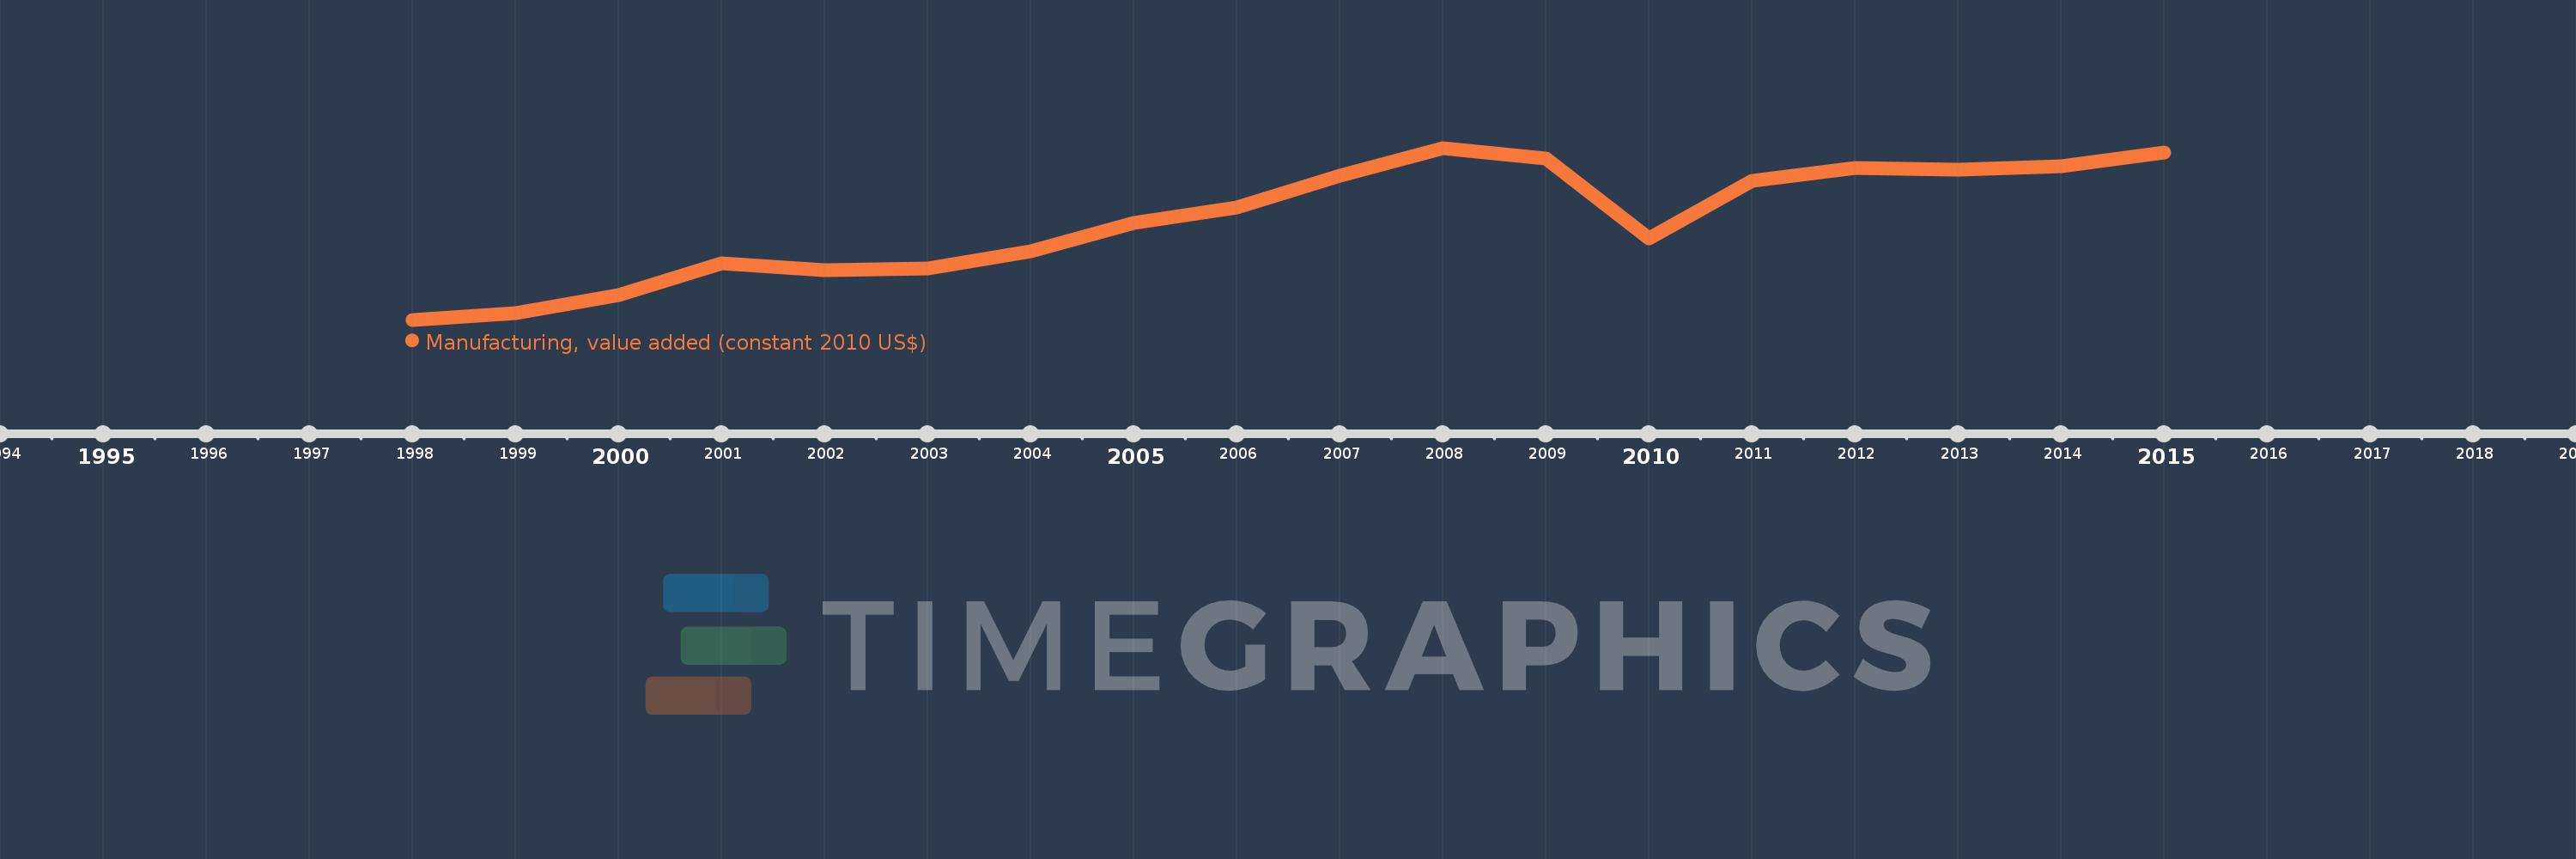
Post-demographic dividend
PST
false
2
1
Manufacturing, value added (constant 2010 US$)
2015,2014,2013,2012,2011,2010,2009,2008,2007,2006,2005,2004,2003,2002,2001,2000,1999,1998
This statistics in other country:
AfghanistanAlbaniaAndorraAntigua and BarbudaArab WorldArgentinaArmeniaArubaAustraliaAustriaAzerbaijanBahamas, TheBahrainBangladeshBarbadosBelarusBelgiumBelizeBeninBermudaBhutanBoliviaBosnia and HerzegovinaBotswanaBrazilBrunei DarussalamBurkina FasoBurundiCambodiaCameroonCanadaCaribbean small statesCentral African RepublicCentral Europe and the BalticsChadChileChinaColombiaComorosCongo, Dem. Rep.Congo, Rep.Costa RicaCote d'IvoireCroatiaCubaCyprusCzech RepublicDenmarkDominicaDominican RepublicEarly-demographic dividendEast Asia & PacificEast Asia & Pacific (excluding high income)East Asia & Pacific (IDA & IBRD countries)EcuadorEgypt, Arab Rep.El SalvadorEquatorial GuineaEstoniaEthiopiaEuro areaEurope & Central AsiaEurope & Central Asia (excluding high income)Europe & Central Asia (IDA & IBRD countries)European UnionFaroe IslandsFijiFinlandFragile and conflict affected situationsFranceGabonGambia, TheGeorgiaGermanyGhanaGreeceGrenadaGuatemalaGuineaGuyanaHeavily indebted poor countries (HIPC)High incomeHondurasHong Kong SAR, ChinaHungaryIBRD onlyIcelandIDA & IBRD totalIDA blendIDA onlyIDA totalIndiaIndonesiaIran, Islamic Rep.IraqIrelandItalyJamaicaJapanJordanKazakhstanKenyaKiribatiKorea, Rep.KosovoKuwaitKyrgyz RepublicLao PDRLate-demographic dividendLatin America & Caribbean Latin America & Caribbean (excluding high income)Latin America & the Caribbean (IDA & IBRD countries)LatviaLeast developed countries: UN classificationLebanonLesothoLiberiaLithuaniaLow & middle incomeLow incomeLower middle incomeLuxembourgMacao SAR, ChinaMacedonia, FYRMalawiMalaysiaMaldivesMaltaMarshall IslandsMauritaniaMauritiusMexicoMicronesia, Fed. Sts.Middle East & North AfricaMiddle East & North Africa (excluding high income)Middle East & North Africa (IDA & IBRD countries)Middle incomeMoldovaMongoliaMontenegroMoroccoMozambiqueMyanmarNamibiaNepalNetherlandsNew ZealandNicaraguaNigerNigeriaNorth AmericaNorwayOECD membersOmanOther small statesPacific island small statesPakistanPalauPanamaParaguayPeruPhilippinesPolandPortugalPost-demographic dividendPre-demographic dividendPuerto RicoQatarRomaniaRussian FederationRwandaSamoaSao Tome and PrincipeSaudi ArabiaSenegalSerbiaSeychellesSierra LeoneSingaporeSlovak RepublicSloveniaSmall statesSouth AfricaSouth AsiaSouth Asia (IDA & IBRD)SpainSri LankaSt. Kitts and NevisSt. LuciaSt. Vincent and the GrenadinesSub-Saharan Africa Sub-Saharan Africa (excluding high income)Sub-Saharan Africa (IDA & IBRD countries)SudanSurinameSwazilandSwedenSwitzerlandTajikistanTanzaniaThailandTimor-LesteTogoTongaTrinidad and TobagoTunisiaTurkeyTuvaluUgandaUkraineUnited Arab EmiratesUnited KingdomUnited StatesUpper middle incomeUruguayUzbekistanVanuatuVenezuela, RBVietnamWest Bank and GazaWorldYemen, Rep.ZambiaZimbabwe Timeline:
This timeline shows a graph from 1998 to 2015 of Post-demographic dividend. No data until 1997. Number of actual observations by date: 18.
Source name:
World Development Indicators
Source organization:
World Bank national accounts data, and OECD National Accounts data files.
Categories, topics:
Economy & Growth
Last updated:
apr 23, 2017
Indicators value changes by year
Minimum:
4.604 trl
jan 1, 1998
Maximum:
6.157 trl
jan 1, 2008
At the date of observation
Value
Absolute change
Change from previous value
jan 1, 1998
4.604 trl
+4.604 trl
0.0%
jan 1, 1999
4.667 trl
+62.386 bln
1.35%
jan 1, 2000
4.829 trl
+162.566 bln
3.48%
jan 1, 2001
5.117 trl
+288.193 bln
5.97%
jan 1, 2002
5.051 trl
-65.937 bln
-1.29%
jan 1, 2003
5.069 trl
+17.469 bln
0.35%
jan 1, 2004
5.221 trl
+152.028 bln
3.0%
jan 1, 2005
5.478 trl
+257.478 bln
4.93%
jan 1, 2006
5.619 trl
+140.923 bln
2.57%
jan 1, 2007
5.91 trl
+290.652 bln
5.17%
jan 1, 2008
6.157 trl
+247.476 bln
4.19%
jan 1, 2009
6.063 trl
-94.249 bln
-1.53%
jan 1, 2010
5.338 trl
-724.949 bln
-11.96%
jan 1, 2011
5.86 trl
+521.483 bln
9.77%
jan 1, 2012
5.975 trl
+115.386 bln
1.97%
jan 1, 2013
5.963 trl
-12.457 bln
-0.21%
jan 1, 2014
5.992 trl
+29.769 bln
0.5%
jan 1, 2015
6.119 trl
+126.158 bln
2.11%
Ranking of countries by current statistics by years


Comments: