29
/
en
AIzaSyAYiBZKx7MnpbEhh9jyipgxe19OcubqV5w
April 1, 2024
269600
Turkey
TUR
true
2
1
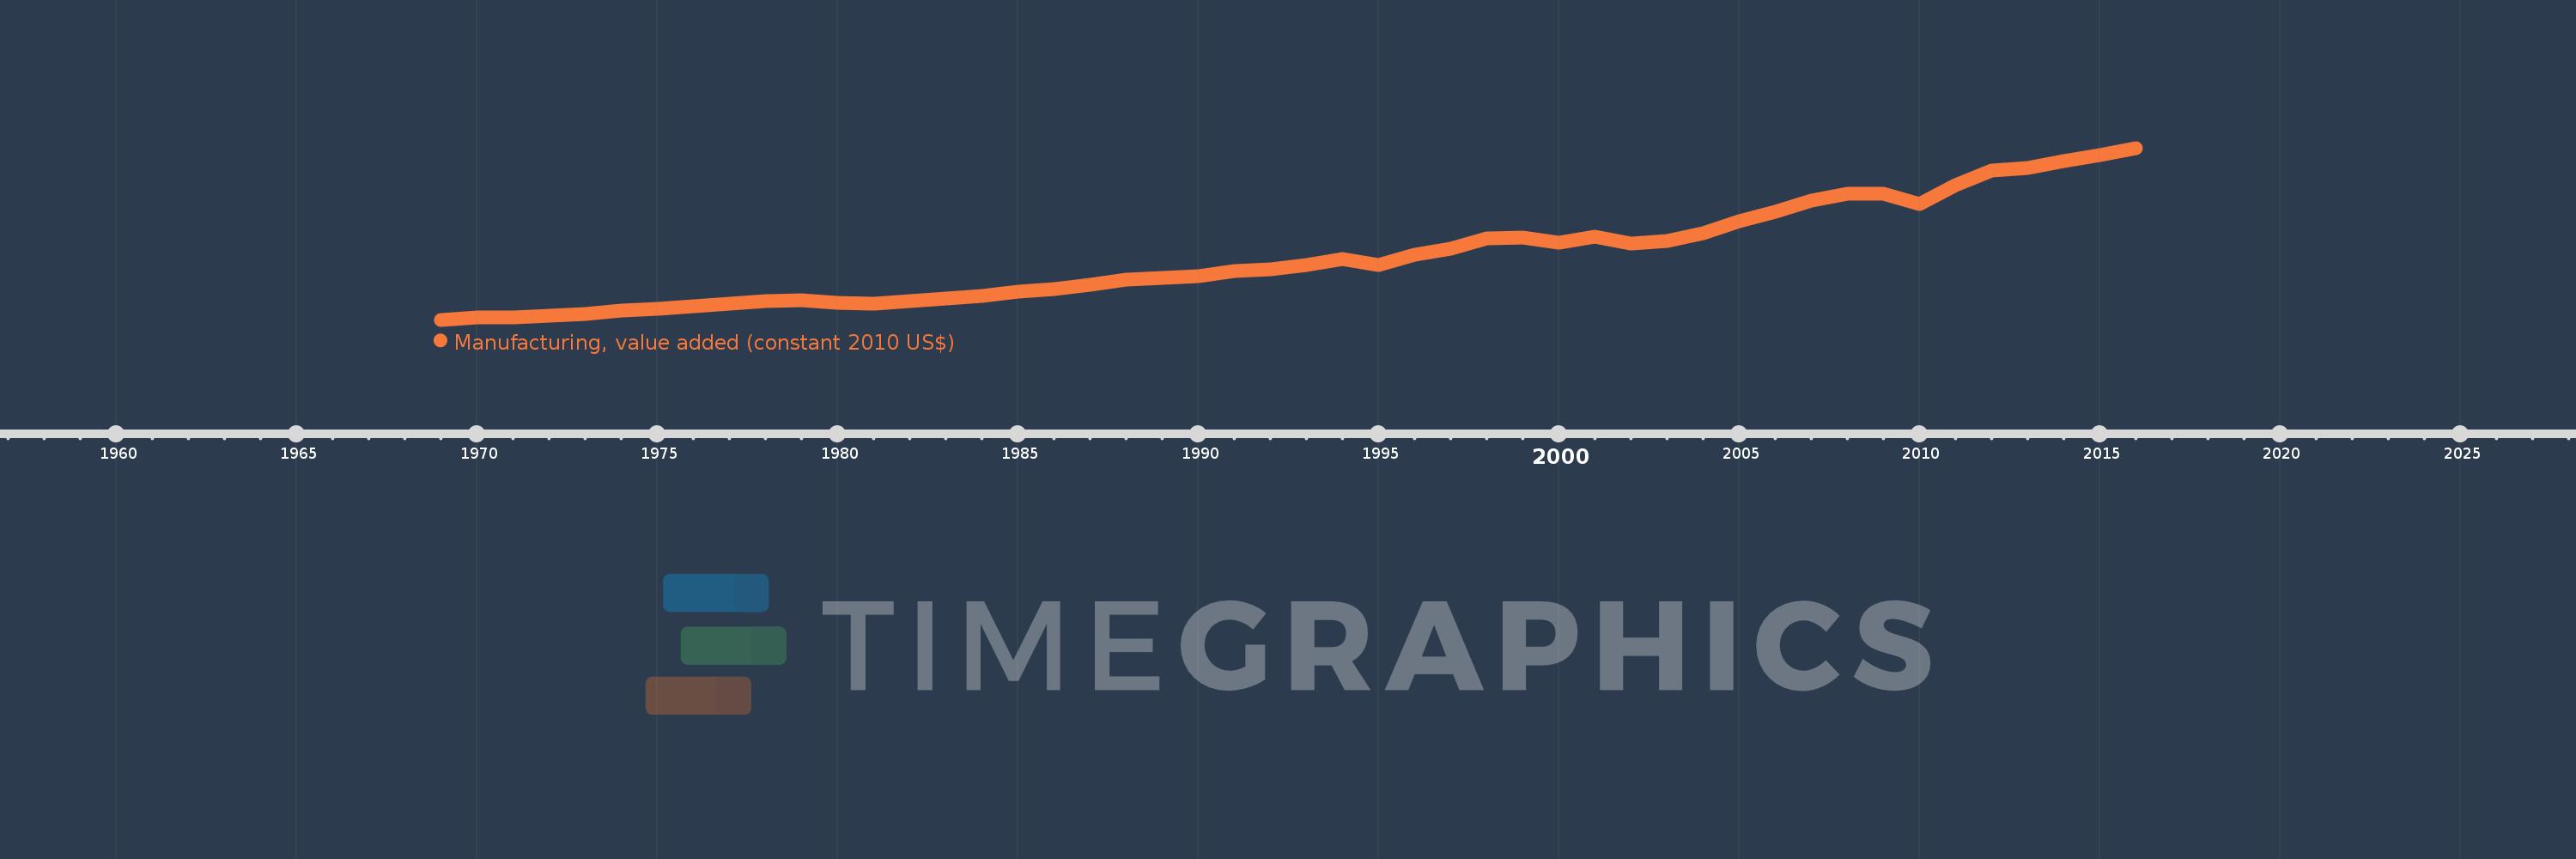
Manufacturing, value added (constant 2010 US$)
2016,2015,2014,2013,2012,2011,2010,2009,2008,2007,2006,2005,2004,2003,2002,2001,2000,1999,1998,1997,1996,1995,1994,1993,1992,1991,1990,1989,1988,1987,1986,1985,1984,1983,1982,1981,1980,1979,1978,1977,1976,1975,1974,1973,1972,1971,1970,1969
This statistics in other country:
AfghanistanAlbaniaAndorraAntigua and BarbudaArab WorldArgentinaArmeniaArubaAustraliaAustriaAzerbaijanBahamas, TheBahrainBangladeshBarbadosBelarusBelgiumBelizeBeninBermudaBhutanBoliviaBosnia and HerzegovinaBotswanaBrazilBrunei DarussalamBurkina FasoBurundiCambodiaCameroonCanadaCaribbean small statesCentral African RepublicCentral Europe and the BalticsChadChileChinaColombiaComorosCongo, Dem. Rep.Congo, Rep.Costa RicaCote d'IvoireCroatiaCubaCyprusCzech RepublicDenmarkDominicaDominican RepublicEarly-demographic dividendEast Asia & PacificEast Asia & Pacific (excluding high income)East Asia & Pacific (IDA & IBRD countries)EcuadorEgypt, Arab Rep.El SalvadorEquatorial GuineaEstoniaEthiopiaEuro areaEurope & Central AsiaEurope & Central Asia (excluding high income)Europe & Central Asia (IDA & IBRD countries)European UnionFaroe IslandsFijiFinlandFragile and conflict affected situationsFranceGabonGambia, TheGeorgiaGermanyGhanaGreeceGrenadaGuatemalaGuineaGuyanaHeavily indebted poor countries (HIPC)High incomeHondurasHong Kong SAR, ChinaHungaryIBRD onlyIcelandIDA & IBRD totalIDA blendIDA onlyIDA totalIndiaIndonesiaIran, Islamic Rep.IraqIrelandItalyJamaicaJapanJordanKazakhstanKenyaKiribatiKorea, Rep.KosovoKuwaitKyrgyz RepublicLao PDRLate-demographic dividendLatin America & Caribbean Latin America & Caribbean (excluding high income)Latin America & the Caribbean (IDA & IBRD countries)LatviaLeast developed countries: UN classificationLebanonLesothoLiberiaLithuaniaLow & middle incomeLow incomeLower middle incomeLuxembourgMacao SAR, ChinaMacedonia, FYRMalawiMalaysiaMaldivesMaltaMarshall IslandsMauritaniaMauritiusMexicoMicronesia, Fed. Sts.Middle East & North AfricaMiddle East & North Africa (excluding high income)Middle East & North Africa (IDA & IBRD countries)Middle incomeMoldovaMongoliaMontenegroMoroccoMozambiqueMyanmarNamibiaNepalNetherlandsNew ZealandNicaraguaNigerNigeriaNorth AmericaNorwayOECD membersOmanOther small statesPacific island small statesPakistanPalauPanamaParaguayPeruPhilippinesPolandPortugalPost-demographic dividendPre-demographic dividendPuerto RicoQatarRomaniaRussian FederationRwandaSamoaSao Tome and PrincipeSaudi ArabiaSenegalSerbiaSeychellesSierra LeoneSingaporeSlovak RepublicSloveniaSmall statesSouth AfricaSouth AsiaSouth Asia (IDA & IBRD)SpainSri LankaSt. Kitts and NevisSt. LuciaSt. Vincent and the GrenadinesSub-Saharan Africa Sub-Saharan Africa (excluding high income)Sub-Saharan Africa (IDA & IBRD countries)SudanSurinameSwazilandSwedenSwitzerlandTajikistanTanzaniaThailandTimor-LesteTogoTongaTrinidad and TobagoTunisiaTurkeyTuvaluUgandaUkraineUnited Arab EmiratesUnited KingdomUnited StatesUpper middle incomeUruguayUzbekistanVanuatuVenezuela, RBVietnamWest Bank and GazaWorldYemen, Rep.ZambiaZimbabwe Timeline:
This timeline shows a graph from 1969 to 2016 of Turkey. No data until 1968. Number of actual observations by date: 48.
Source name:
World Development Indicators
Source organization:
World Bank national accounts data, and OECD National Accounts data files.
Categories, topics:
Economy & Growth
Last updated:
apr 23, 2017
Indicators value changes by year
Minimum:
12.579 bln
jan 1, 1969
Maximum:
141.891 bln
jan 1, 2016
At the date of observation
Value
Absolute change
Change from previous value
jan 1, 1969
12.579 bln
+12.579 bln
0.0%
jan 1, 1970
14.051 bln
+1.472 bln
11.7%
jan 1, 1971
14.276 bln
+224.814 mln
1.6%
jan 1, 1972
15.518 bln
+1.242 bln
8.7%
jan 1, 1973
17.209 bln
+1.691 bln
10.9%
jan 1, 1974
19.429 bln
+2.22 bln
12.9%
jan 1, 1975
20.847 bln
+1.418 bln
7.3%
jan 1, 1976
22.661 bln
+1.814 bln
8.7%
jan 1, 1977
24.701 bln
+2.04 bln
9.0%
jan 1, 1978
26.331 bln
+1.63 bln
6.6%
jan 1, 1979
27.173 bln
+842.588 mln
3.2%
jan 1, 1980
25.516 bln
-1.658 bln
-6.1%
jan 1, 1981
24.516 bln
-1.0 bln
-3.92%
jan 1, 1982
26.83 bln
+2.314 bln
9.44%
jan 1, 1983
28.552 bln
+1.722 bln
6.42%
jan 1, 1984
30.682 bln
+2.13 bln
7.46%
jan 1, 1985
33.521 bln
+2.838 bln
9.25%
jan 1, 1986
35.431 bln
+1.911 bln
5.7%
jan 1, 1987
39.151 bln
+3.72 bln
10.5%
jan 1, 1988
43.09 bln
+3.939 bln
10.06%
jan 1, 1989
43.768 bln
+677.836 mln
1.57%
jan 1, 1990
45.09 bln
+1.322 bln
3.02%
jan 1, 1991
49.455 bln
+4.365 bln
9.68%
jan 1, 1992
50.632 bln
+1.177 bln
2.38%
jan 1, 1993
53.553 bln
+2.921 bln
5.77%
jan 1, 1994
58.532 bln
+4.978 bln
9.3%
jan 1, 1995
54.059 bln
-4.473 bln
-7.64%
jan 1, 1996
61.581 bln
+7.522 bln
13.91%
jan 1, 1997
65.96 bln
+4.38 bln
7.11%
jan 1, 1998
73.51 bln
+7.549 bln
11.45%
jan 1, 1999
74.373 bln
+862.94 mln
1.17%
jan 1, 2000
70.513 bln
-3.86 bln
-5.19%
jan 1, 2001
75.367 bln
+4.854 bln
6.88%
jan 1, 2002
69.716 bln
-5.651 bln
-7.5%
jan 1, 2003
71.847 bln
+2.131 bln
3.06%
jan 1, 2004
77.802 bln
+5.955 bln
8.29%
jan 1, 2005
86.898 bln
+9.096 bln
11.69%
jan 1, 2006
94.033 bln
+7.135 bln
8.21%
jan 1, 2007
101.993 bln
+7.959 bln
8.46%
jan 1, 2008
107.736 bln
+5.743 bln
5.63%
jan 1, 2009
107.616 bln
-120.184 mln
-0.11%
jan 1, 2010
99.812 bln
-7.803 bln
-7.25%
jan 1, 2011
113.621 bln
+13.808 bln
13.83%
jan 1, 2012
124.981 bln
+11.36 bln
10.0%
jan 1, 2013
127.13 bln
+2.149 bln
1.72%
jan 1, 2014
131.864 bln
+4.735 bln
3.72%
jan 1, 2015
136.679 bln
+4.815 bln
3.65%
jan 1, 2016
141.891 bln
+5.212 bln
3.81%
Ranking of countries by current statistics by years


Comments: