29
/
en
AIzaSyAYiBZKx7MnpbEhh9jyipgxe19OcubqV5w
April 1, 2024
135773
Gabon
GAB
true
2
1
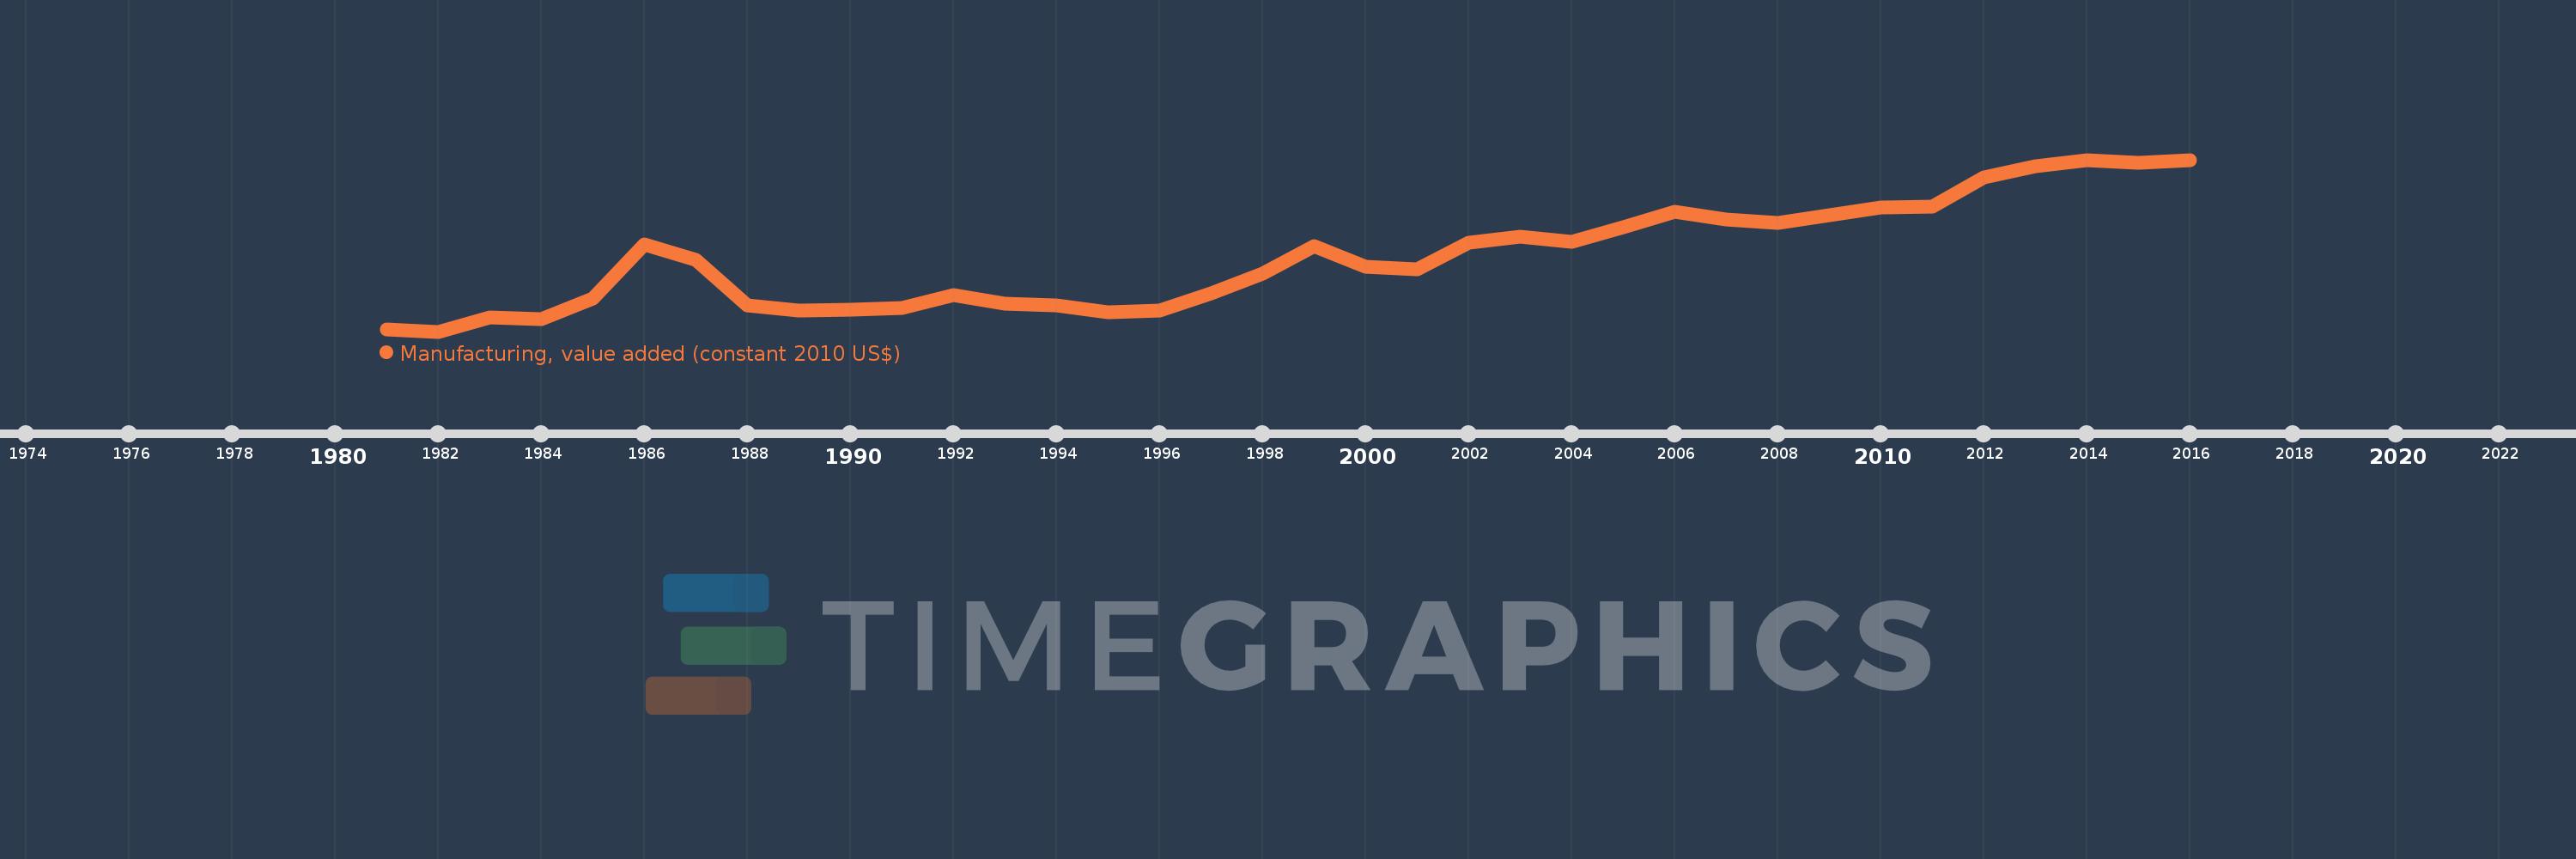
Manufacturing, value added (constant 2010 US$)
2016,2015,2014,2013,2012,2011,2010,2009,2008,2007,2006,2005,2004,2003,2002,2001,2000,1999,1998,1997,1996,1995,1994,1993,1992,1991,1990,1989,1988,1987,1986,1985,1984,1983,1982,1981
This statistics in other country:
AfghanistanAlbaniaAndorraAntigua and BarbudaArab WorldArgentinaArmeniaArubaAustraliaAustriaAzerbaijanBahamas, TheBahrainBangladeshBarbadosBelarusBelgiumBelizeBeninBermudaBhutanBoliviaBosnia and HerzegovinaBotswanaBrazilBrunei DarussalamBurkina FasoBurundiCambodiaCameroonCanadaCaribbean small statesCentral African RepublicCentral Europe and the BalticsChadChileChinaColombiaComorosCongo, Dem. Rep.Congo, Rep.Costa RicaCote d'IvoireCroatiaCubaCyprusCzech RepublicDenmarkDominicaDominican RepublicEarly-demographic dividendEast Asia & PacificEast Asia & Pacific (excluding high income)East Asia & Pacific (IDA & IBRD countries)EcuadorEgypt, Arab Rep.El SalvadorEquatorial GuineaEstoniaEthiopiaEuro areaEurope & Central AsiaEurope & Central Asia (excluding high income)Europe & Central Asia (IDA & IBRD countries)European UnionFaroe IslandsFijiFinlandFragile and conflict affected situationsFranceGabonGambia, TheGeorgiaGermanyGhanaGreeceGrenadaGuatemalaGuineaGuyanaHeavily indebted poor countries (HIPC)High incomeHondurasHong Kong SAR, ChinaHungaryIBRD onlyIcelandIDA & IBRD totalIDA blendIDA onlyIDA totalIndiaIndonesiaIran, Islamic Rep.IraqIrelandItalyJamaicaJapanJordanKazakhstanKenyaKiribatiKorea, Rep.KosovoKuwaitKyrgyz RepublicLao PDRLate-demographic dividendLatin America & Caribbean Latin America & Caribbean (excluding high income)Latin America & the Caribbean (IDA & IBRD countries)LatviaLeast developed countries: UN classificationLebanonLesothoLiberiaLithuaniaLow & middle incomeLow incomeLower middle incomeLuxembourgMacao SAR, ChinaMacedonia, FYRMalawiMalaysiaMaldivesMaltaMarshall IslandsMauritaniaMauritiusMexicoMicronesia, Fed. Sts.Middle East & North AfricaMiddle East & North Africa (excluding high income)Middle East & North Africa (IDA & IBRD countries)Middle incomeMoldovaMongoliaMontenegroMoroccoMozambiqueMyanmarNamibiaNepalNetherlandsNew ZealandNicaraguaNigerNigeriaNorth AmericaNorwayOECD membersOmanOther small statesPacific island small statesPakistanPalauPanamaParaguayPeruPhilippinesPolandPortugalPost-demographic dividendPre-demographic dividendPuerto RicoQatarRomaniaRussian FederationRwandaSamoaSao Tome and PrincipeSaudi ArabiaSenegalSerbiaSeychellesSierra LeoneSingaporeSlovak RepublicSloveniaSmall statesSouth AfricaSouth AsiaSouth Asia (IDA & IBRD)SpainSri LankaSt. Kitts and NevisSt. LuciaSt. Vincent and the GrenadinesSub-Saharan Africa Sub-Saharan Africa (excluding high income)Sub-Saharan Africa (IDA & IBRD countries)SudanSurinameSwazilandSwedenSwitzerlandTajikistanTanzaniaThailandTimor-LesteTogoTongaTrinidad and TobagoTunisiaTurkeyTuvaluUgandaUkraineUnited Arab EmiratesUnited KingdomUnited StatesUpper middle incomeUruguayUzbekistanVanuatuVenezuela, RBVietnamWest Bank and GazaWorldYemen, Rep.ZambiaZimbabwe Timeline:
This timeline shows a graph from 1981 to 2016 of Gabon. No data until 1980. Number of actual observations by date: 36.
Source name:
World Development Indicators
Source organization:
World Bank national accounts data, and OECD National Accounts data files.
Categories, topics:
Economy & Growth
Last updated:
apr 23, 2017
Indicators value changes by year
Minimum:
139.907 mln
jan 1, 1982
Maximum:
330.758 mln
jan 1, 2016
At the date of observation
Value
Absolute change
Change from previous value
jan 1, 1981
142.402 mln
+142.402 mln
0.0%
jan 1, 1982
139.907 mln
-2.495 mln
-1.75%
jan 1, 1983
155.836 mln
+15.929 mln
11.39%
jan 1, 1984
154.109 mln
-1.727 mln
-1.11%
jan 1, 1985
176.179 mln
+22.07 mln
14.32%
jan 1, 1986
236.441 mln
+60.262 mln
34.2%
jan 1, 1987
219.744 mln
-16.697 mln
-7.06%
jan 1, 1988
168.695 mln
-51.05 mln
-23.23%
jan 1, 1989
163.129 mln
-5.566 mln
-3.3%
jan 1, 1990
164.281 mln
+1.151 mln
0.71%
jan 1, 1991
165.816 mln
+1.535 mln
0.93%
jan 1, 1992
180.555 mln
+14.739 mln
8.89%
jan 1, 1993
171.382 mln
-9.174 mln
-5.08%
jan 1, 1994
169.462 mln
-1.919 mln
-1.12%
jan 1, 1995
161.018 mln
-8.444 mln
-4.98%
jan 1, 1996
163.129 mln
+2.111 mln
1.31%
jan 1, 1997
181.937 mln
+18.808 mln
11.53%
jan 1, 1998
204.583 mln
+22.646 mln
12.45%
jan 1, 1999
234.522 mln
+29.939 mln
14.63%
jan 1, 2000
212.068 mln
-22.454 mln
-9.57%
jan 1, 2001
209.381 mln
-2.687 mln
-1.27%
jan 1, 2002
238.936 mln
+29.555 mln
14.12%
jan 1, 2003
245.264 mln
+6.328 mln
2.65%
jan 1, 2004
239.711 mln
-5.554 mln
-2.26%
jan 1, 2005
255.663 mln
+15.953 mln
6.66%
jan 1, 2006
273.188 mln
+17.525 mln
6.85%
jan 1, 2007
264.422 mln
-8.766 mln
-3.21%
jan 1, 2008
260.96 mln
-3.462 mln
-1.31%
jan 1, 2009
269.365 mln
+8.406 mln
3.22%
jan 1, 2010
277.829 mln
+8.463 mln
3.14%
jan 1, 2011
279.134 mln
+1.306 mln
0.47%
jan 1, 2012
311.235 mln
+32.1 mln
11.5%
jan 1, 2013
323.684 mln
+12.449 mln
4.0%
jan 1, 2014
330.674 mln
+6.99 mln
2.16%
jan 1, 2015
327.037 mln
-3.637 mln
-1.1%
jan 1, 2016
330.758 mln
+3.722 mln
1.14%
Ranking of countries by current statistics by years


Comments: