29
/
en
AIzaSyAYiBZKx7MnpbEhh9jyipgxe19OcubqV5w
April 1, 2024
123764
Ecuador
ECU
true
2
1
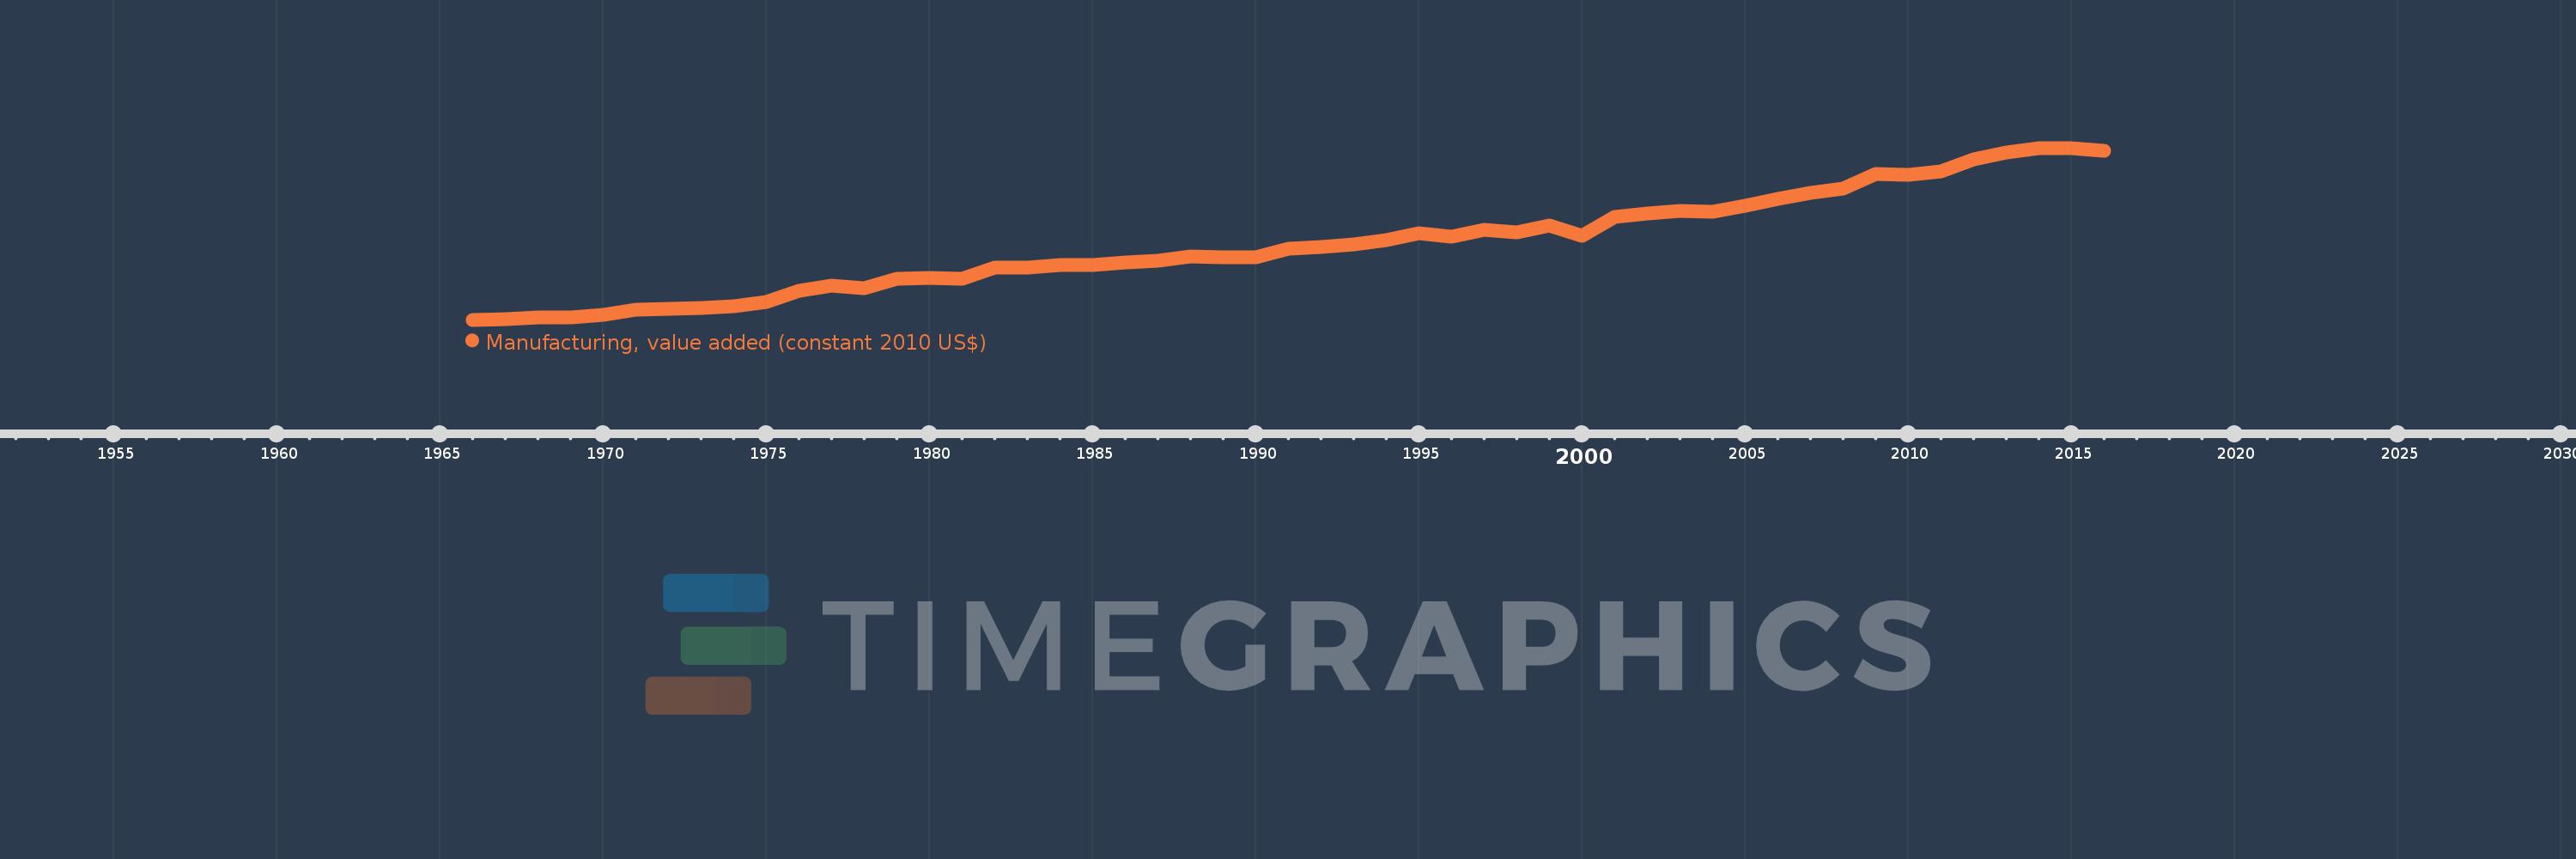
Manufacturing, value added (constant 2010 US$)
2016,2015,2014,2013,2012,2011,2010,2009,2008,2007,2006,2005,2004,2003,2002,2001,2000,1999,1998,1997,1996,1995,1994,1993,1992,1991,1990,1989,1988,1987,1986,1985,1984,1983,1982,1981,1980,1979,1978,1977,1976,1975,1974,1973,1972,1971,1970,1969,1968,1967,1966
This statistics in other country:
AfghanistanAlbaniaAndorraAntigua and BarbudaArab WorldArgentinaArmeniaArubaAustraliaAustriaAzerbaijanBahamas, TheBahrainBangladeshBarbadosBelarusBelgiumBelizeBeninBermudaBhutanBoliviaBosnia and HerzegovinaBotswanaBrazilBrunei DarussalamBurkina FasoBurundiCambodiaCameroonCanadaCaribbean small statesCentral African RepublicCentral Europe and the BalticsChadChileChinaColombiaComorosCongo, Dem. Rep.Congo, Rep.Costa RicaCote d'IvoireCroatiaCubaCyprusCzech RepublicDenmarkDominicaDominican RepublicEarly-demographic dividendEast Asia & PacificEast Asia & Pacific (excluding high income)East Asia & Pacific (IDA & IBRD countries)EcuadorEgypt, Arab Rep.El SalvadorEquatorial GuineaEstoniaEthiopiaEuro areaEurope & Central AsiaEurope & Central Asia (excluding high income)Europe & Central Asia (IDA & IBRD countries)European UnionFaroe IslandsFijiFinlandFragile and conflict affected situationsFranceGabonGambia, TheGeorgiaGermanyGhanaGreeceGrenadaGuatemalaGuineaGuyanaHeavily indebted poor countries (HIPC)High incomeHondurasHong Kong SAR, ChinaHungaryIBRD onlyIcelandIDA & IBRD totalIDA blendIDA onlyIDA totalIndiaIndonesiaIran, Islamic Rep.IraqIrelandItalyJamaicaJapanJordanKazakhstanKenyaKiribatiKorea, Rep.KosovoKuwaitKyrgyz RepublicLao PDRLate-demographic dividendLatin America & Caribbean Latin America & Caribbean (excluding high income)Latin America & the Caribbean (IDA & IBRD countries)LatviaLeast developed countries: UN classificationLebanonLesothoLiberiaLithuaniaLow & middle incomeLow incomeLower middle incomeLuxembourgMacao SAR, ChinaMacedonia, FYRMalawiMalaysiaMaldivesMaltaMarshall IslandsMauritaniaMauritiusMexicoMicronesia, Fed. Sts.Middle East & North AfricaMiddle East & North Africa (excluding high income)Middle East & North Africa (IDA & IBRD countries)Middle incomeMoldovaMongoliaMontenegroMoroccoMozambiqueMyanmarNamibiaNepalNetherlandsNew ZealandNicaraguaNigerNigeriaNorth AmericaNorwayOECD membersOmanOther small statesPacific island small statesPakistanPalauPanamaParaguayPeruPhilippinesPolandPortugalPost-demographic dividendPre-demographic dividendPuerto RicoQatarRomaniaRussian FederationRwandaSamoaSao Tome and PrincipeSaudi ArabiaSenegalSerbiaSeychellesSierra LeoneSingaporeSlovak RepublicSloveniaSmall statesSouth AfricaSouth AsiaSouth Asia (IDA & IBRD)SpainSri LankaSt. Kitts and NevisSt. LuciaSt. Vincent and the GrenadinesSub-Saharan Africa Sub-Saharan Africa (excluding high income)Sub-Saharan Africa (IDA & IBRD countries)SudanSurinameSwazilandSwedenSwitzerlandTajikistanTanzaniaThailandTimor-LesteTogoTongaTrinidad and TobagoTunisiaTurkeyTuvaluUgandaUkraineUnited Arab EmiratesUnited KingdomUnited StatesUpper middle incomeUruguayUzbekistanVanuatuVenezuela, RBVietnamWest Bank and GazaWorldYemen, Rep.ZambiaZimbabwe Timeline:
This timeline shows a graph from 1966 to 2016 of Ecuador. No data until 1965. Number of actual observations by date: 51.
Source name:
World Development Indicators
Source organization:
World Bank national accounts data, and OECD National Accounts data files.
Categories, topics:
Economy & Growth
Last updated:
apr 23, 2017
Indicators value changes by year
Minimum:
1.432 bln
jan 1, 1966
Maximum:
10.545 bln
jan 1, 2014
At the date of observation
Value
Absolute change
Change from previous value
jan 1, 1966
1.432 bln
+1.432 bln
0.0%
jan 1, 1967
1.468 bln
+35.315 mln
2.47%
jan 1, 1968
1.542 bln
+74.404 mln
5.07%
jan 1, 1969
1.564 bln
+22.325 mln
1.45%
jan 1, 1970
1.701 bln
+136.8 mln
8.74%
jan 1, 1971
1.974 bln
+272.715 mln
16.03%
jan 1, 1972
2.021 bln
+46.999 mln
2.38%
jan 1, 1973
2.069 bln
+47.567 mln
2.35%
jan 1, 1974
2.153 bln
+84.424 mln
4.08%
jan 1, 1975
2.381 bln
+227.942 mln
10.59%
jan 1, 1976
2.985 bln
+604.602 mln
25.39%
jan 1, 1977
3.259 bln
+273.565 mln
9.16%
jan 1, 1978
3.108 bln
-150.597 mln
-4.62%
jan 1, 1979
3.595 bln
+486.843 mln
15.66%
jan 1, 1980
3.672 bln
+76.479 mln
2.13%
jan 1, 1981
3.624 bln
-47.921 mln
-1.31%
jan 1, 1982
4.191 bln
+567.432 mln
15.66%
jan 1, 1983
4.204 bln
+12.493 mln
0.3%
jan 1, 1984
4.329 bln
+125.055 mln
2.97%
jan 1, 1985
4.343 bln
+14.276 mln
0.33%
jan 1, 1986
4.49 bln
+147.311 mln
3.39%
jan 1, 1987
4.558 bln
+67.728 mln
1.51%
jan 1, 1988
4.808 bln
+249.711 mln
5.48%
jan 1, 1989
4.733 bln
-74.496 mln
-1.55%
jan 1, 1990
4.73 bln
-3.77 mln
-0.08%
jan 1, 1991
5.208 bln
+478.074 mln
10.11%
jan 1, 1992
5.311 bln
+103.14 mln
1.98%
jan 1, 1993
5.415 bln
+104.012 mln
1.96%
jan 1, 1994
5.655 bln
+240.01 mln
4.43%
jan 1, 1995
6.018 bln
+363.378 mln
6.43%
jan 1, 1996
5.819 bln
-198.793 mln
-3.3%
jan 1, 1997
6.225 bln
+405.909 mln
6.98%
jan 1, 1998
6.058 bln
-167.008 mln
-2.68%
jan 1, 1999
6.418 bln
+359.683 mln
5.94%
jan 1, 2000
5.89 bln
-528.389 mln
-8.23%
jan 1, 2001
6.905 bln
+1.015 bln
17.24%
jan 1, 2002
7.062 bln
+157.126 mln
2.28%
jan 1, 2003
7.187 bln
+124.917 mln
1.77%
jan 1, 2004
7.173 bln
-13.736 mln
-0.19%
jan 1, 2005
7.489 bln
+315.841 mln
4.4%
jan 1, 2006
7.828 bln
+339.404 mln
4.53%
jan 1, 2007
8.15 bln
+321.742 mln
4.11%
jan 1, 2008
8.408 bln
+257.369 mln
3.16%
jan 1, 2009
9.174 bln
+766.192 mln
9.11%
jan 1, 2010
9.103 bln
-70.543 mln
-0.77%
jan 1, 2011
9.322 bln
+218.557 mln
2.4%
jan 1, 2012
9.917 bln
+595.334 mln
6.39%
jan 1, 2013
10.323 bln
+405.458 mln
4.09%
jan 1, 2014
10.545 bln
+222.875 mln
2.16%
jan 1, 2015
10.511 bln
-34.466 mln
-0.33%
jan 1, 2016
10.417 bln
-93.99 mln
-0.89%
Ranking of countries by current statistics by years


Comments: