29
/
en
AIzaSyAYiBZKx7MnpbEhh9jyipgxe19OcubqV5w
April 1, 2024
255420
Swaziland
SWZ
true
2
1
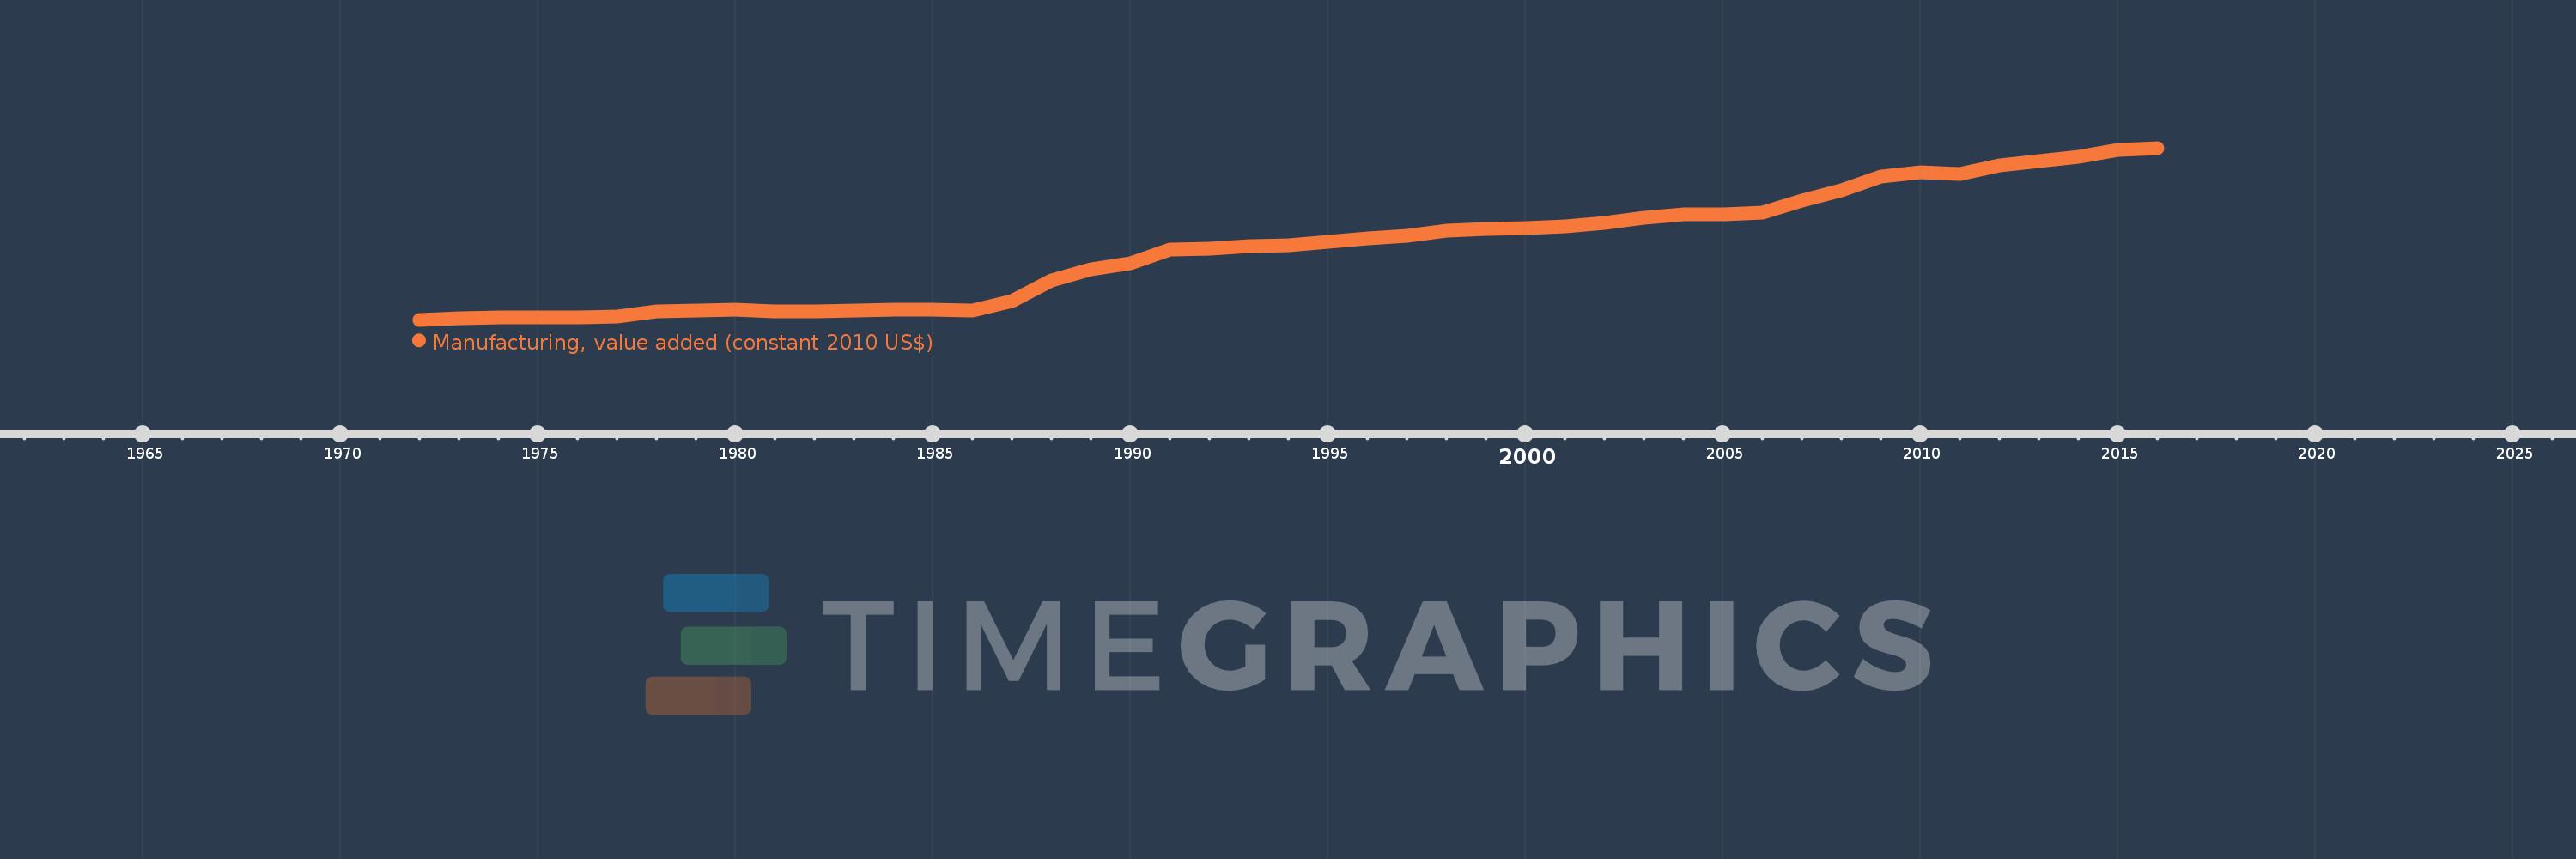
Manufacturing, value added (constant 2010 US$)
2016,2015,2014,2013,2012,2011,2010,2009,2008,2007,2006,2005,2004,2003,2002,2001,2000,1999,1998,1997,1996,1995,1994,1993,1992,1991,1990,1989,1988,1987,1986,1985,1984,1983,1982,1981,1980,1979,1978,1977,1976,1975,1974,1973,1972
This statistics in other country:
AfghanistanAlbaniaAndorraAntigua and BarbudaArab WorldArgentinaArmeniaArubaAustraliaAustriaAzerbaijanBahamas, TheBahrainBangladeshBarbadosBelarusBelgiumBelizeBeninBermudaBhutanBoliviaBosnia and HerzegovinaBotswanaBrazilBrunei DarussalamBurkina FasoBurundiCambodiaCameroonCanadaCaribbean small statesCentral African RepublicCentral Europe and the BalticsChadChileChinaColombiaComorosCongo, Dem. Rep.Congo, Rep.Costa RicaCote d'IvoireCroatiaCubaCyprusCzech RepublicDenmarkDominicaDominican RepublicEarly-demographic dividendEast Asia & PacificEast Asia & Pacific (excluding high income)East Asia & Pacific (IDA & IBRD countries)EcuadorEgypt, Arab Rep.El SalvadorEquatorial GuineaEstoniaEthiopiaEuro areaEurope & Central AsiaEurope & Central Asia (excluding high income)Europe & Central Asia (IDA & IBRD countries)European UnionFaroe IslandsFijiFinlandFragile and conflict affected situationsFranceGabonGambia, TheGeorgiaGermanyGhanaGreeceGrenadaGuatemalaGuineaGuyanaHeavily indebted poor countries (HIPC)High incomeHondurasHong Kong SAR, ChinaHungaryIBRD onlyIcelandIDA & IBRD totalIDA blendIDA onlyIDA totalIndiaIndonesiaIran, Islamic Rep.IraqIrelandItalyJamaicaJapanJordanKazakhstanKenyaKiribatiKorea, Rep.KosovoKuwaitKyrgyz RepublicLao PDRLate-demographic dividendLatin America & Caribbean Latin America & Caribbean (excluding high income)Latin America & the Caribbean (IDA & IBRD countries)LatviaLeast developed countries: UN classificationLebanonLesothoLiberiaLithuaniaLow & middle incomeLow incomeLower middle incomeLuxembourgMacao SAR, ChinaMacedonia, FYRMalawiMalaysiaMaldivesMaltaMarshall IslandsMauritaniaMauritiusMexicoMicronesia, Fed. Sts.Middle East & North AfricaMiddle East & North Africa (excluding high income)Middle East & North Africa (IDA & IBRD countries)Middle incomeMoldovaMongoliaMontenegroMoroccoMozambiqueMyanmarNamibiaNepalNetherlandsNew ZealandNicaraguaNigerNigeriaNorth AmericaNorwayOECD membersOmanOther small statesPacific island small statesPakistanPalauPanamaParaguayPeruPhilippinesPolandPortugalPost-demographic dividendPre-demographic dividendPuerto RicoQatarRomaniaRussian FederationRwandaSamoaSao Tome and PrincipeSaudi ArabiaSenegalSerbiaSeychellesSierra LeoneSingaporeSlovak RepublicSloveniaSmall statesSouth AfricaSouth AsiaSouth Asia (IDA & IBRD)SpainSri LankaSt. Kitts and NevisSt. LuciaSt. Vincent and the GrenadinesSub-Saharan Africa Sub-Saharan Africa (excluding high income)Sub-Saharan Africa (IDA & IBRD countries)SudanSurinameSwazilandSwedenSwitzerlandTajikistanTanzaniaThailandTimor-LesteTogoTongaTrinidad and TobagoTunisiaTurkeyTuvaluUgandaUkraineUnited Arab EmiratesUnited KingdomUnited StatesUpper middle incomeUruguayUzbekistanVanuatuVenezuela, RBVietnamWest Bank and GazaWorldYemen, Rep.ZambiaZimbabwe Timeline:
This timeline shows a graph from 1972 to 2016 of Swaziland. No data until 1971. Number of actual observations by date: 45.
Source name:
World Development Indicators
Source organization:
World Bank national accounts data, and OECD National Accounts data files.
Categories, topics:
Economy & Growth
Last updated:
apr 23, 2017
Indicators value changes by year
Minimum:
114.362 mln
jan 1, 1972
Maximum:
1.777 bln
jan 1, 2016
At the date of observation
Value
Absolute change
Change from previous value
jan 1, 1972
114.362 mln
+114.362 mln
0.0%
jan 1, 1973
126.429 mln
+12.067 mln
10.55%
jan 1, 1974
135.052 mln
+8.622 mln
6.82%
jan 1, 1975
135.052 mln
0.0
0.0%
jan 1, 1976
134.186 mln
-866.096K
-0.64%
jan 1, 1977
142.789 mln
+8.603 mln
6.41%
jan 1, 1978
192.675 mln
+49.887 mln
34.94%
jan 1, 1979
206.071 mln
+13.395 mln
6.95%
jan 1, 1980
211.248 mln
+5.177 mln
2.51%
jan 1, 1981
195.377 mln
-15.871 mln
-7.51%
jan 1, 1982
196.313 mln
+935.855K
0.48%
jan 1, 1983
206.514 mln
+10.201 mln
5.2%
jan 1, 1984
208.823 mln
+2.31 mln
1.12%
jan 1, 1985
207.668 mln
-1.155 mln
-0.55%
jan 1, 1986
204.974 mln
-2.694 mln
-1.3%
jan 1, 1987
296.394 mln
+91.42 mln
44.6%
jan 1, 1988
490.782 mln
+194.388 mln
65.58%
jan 1, 1989
604.336 mln
+113.554 mln
23.14%
jan 1, 1990
660.151 mln
+55.814 mln
9.24%
jan 1, 1991
793.143 mln
+132.992 mln
20.15%
jan 1, 1992
803.536 mln
+10.393 mln
1.31%
jan 1, 1993
825.669 mln
+22.133 mln
2.75%
jan 1, 1994
833.175 mln
+7.506 mln
0.91%
jan 1, 1995
869.744 mln
+36.568 mln
4.39%
jan 1, 1996
904.195 mln
+34.451 mln
3.96%
jan 1, 1997
926.328 mln
+22.133 mln
2.45%
jan 1, 1998
977.331 mln
+51.003 mln
5.51%
jan 1, 1999
992.728 mln
+15.397 mln
1.58%
jan 1, 2000
1.005 bln
+12.51 mln
1.26%
jan 1, 2001
1.02 bln
+14.82 mln
1.47%
jan 1, 2002
1.05 bln
+29.976 mln
2.94%
jan 1, 2003
1.099 bln
+48.909 mln
4.66%
jan 1, 2004
1.138 bln
+38.99 mln
3.55%
jan 1, 2005
1.134 bln
-3.887 mln
-0.34%
jan 1, 2006
1.151 bln
+17.371 mln
1.53%
jan 1, 2007
1.27 bln
+118.894 mln
10.33%
jan 1, 2008
1.369 bln
+98.711 mln
7.77%
jan 1, 2009
1.504 bln
+135.092 mln
9.87%
jan 1, 2010
1.54 bln
+35.476 mln
2.36%
jan 1, 2011
1.525 bln
-15.004 mln
-0.97%
jan 1, 2012
1.612 bln
+87.109 mln
5.71%
jan 1, 2013
1.646 bln
+34.709 mln
2.15%
jan 1, 2014
1.694 bln
+47.192 mln
2.87%
jan 1, 2015
1.76 bln
+66.199 mln
3.91%
jan 1, 2016
1.777 bln
+17.424 mln
0.99%
Ranking of countries by current statistics by years


Comments: