29
/
en
AIzaSyAYiBZKx7MnpbEhh9jyipgxe19OcubqV5w
April 1, 2024
234862
Saudi Arabia
SAU
true
2
1
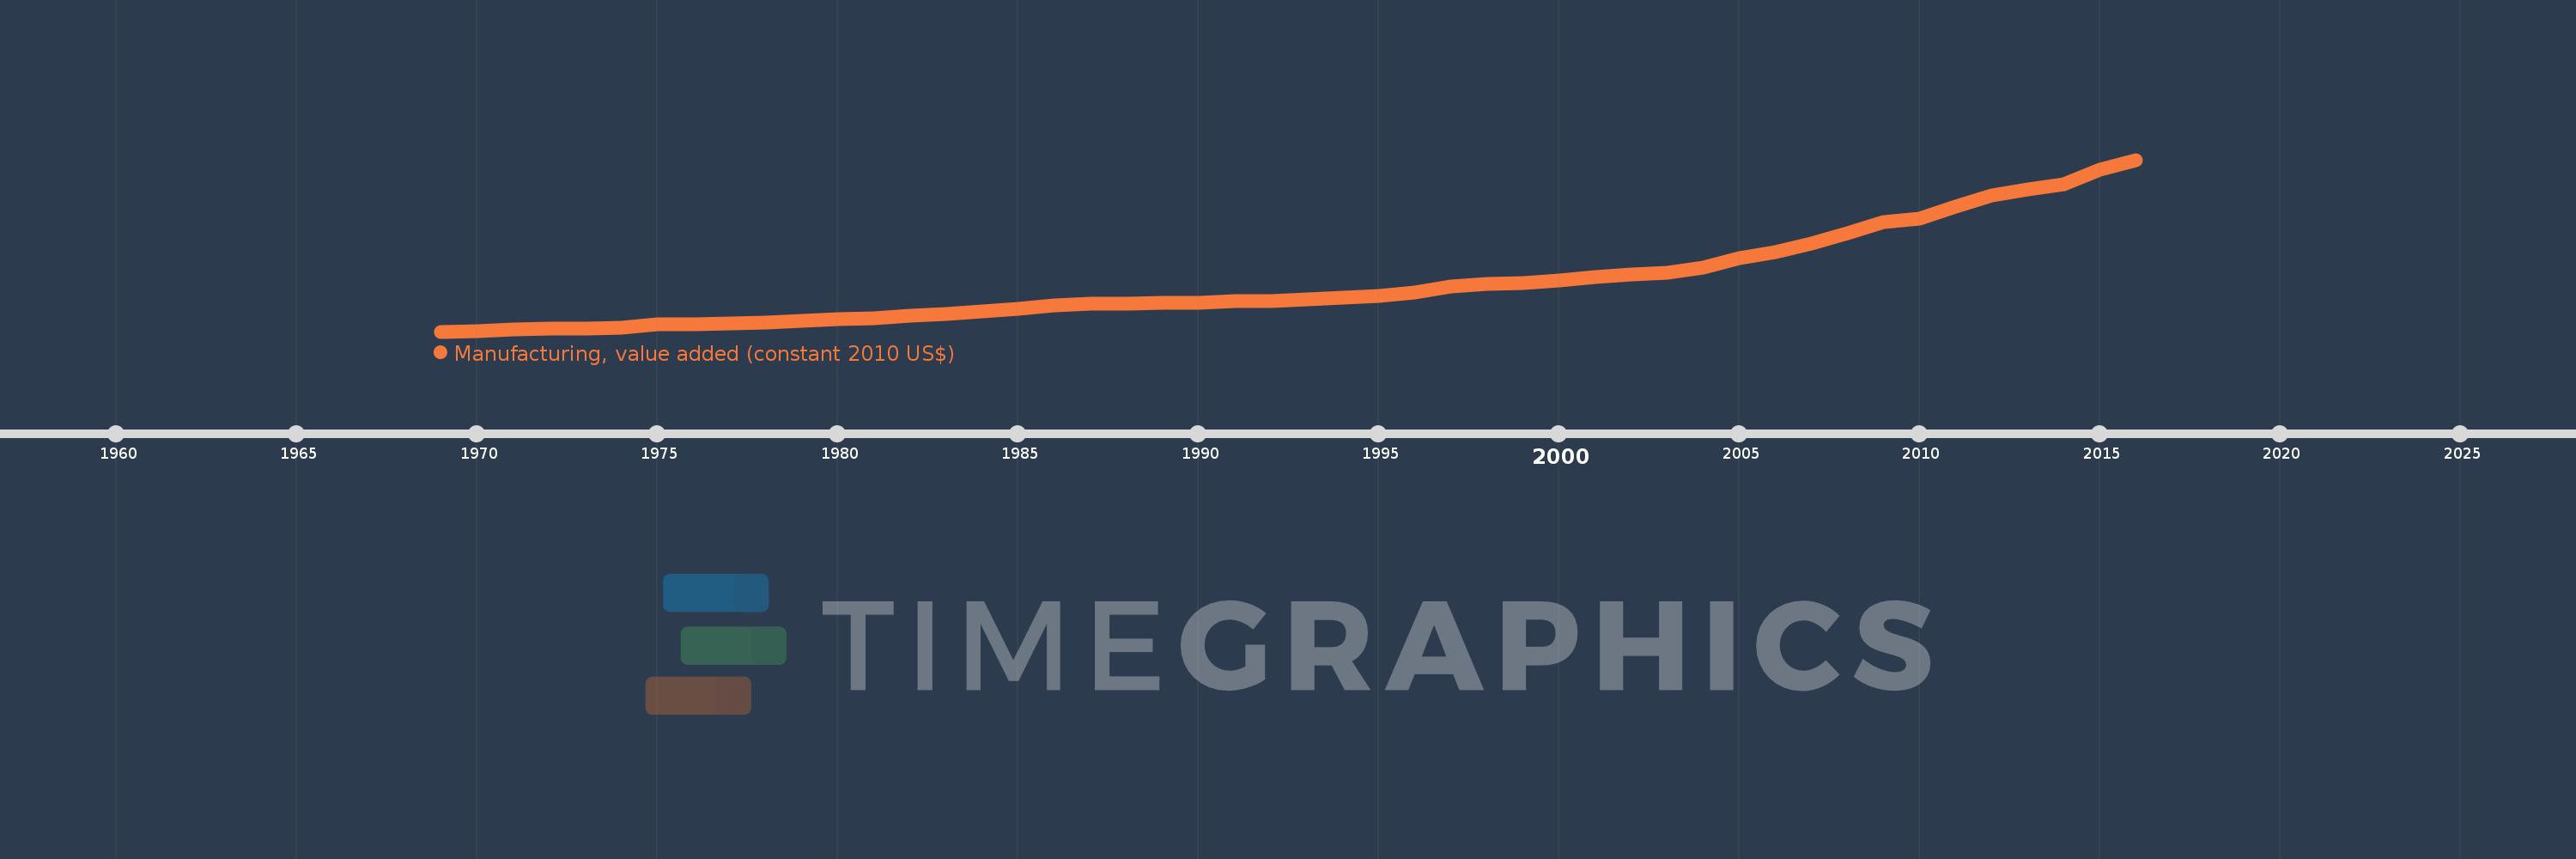
Manufacturing, value added (constant 2010 US$)
2016,2015,2014,2013,2012,2011,2010,2009,2008,2007,2006,2005,2004,2003,2002,2001,2000,1999,1998,1997,1996,1995,1994,1993,1992,1991,1990,1989,1988,1987,1986,1985,1984,1983,1982,1981,1980,1979,1978,1977,1976,1975,1974,1973,1972,1971,1970,1969
This statistics in other country:
AfghanistanAlbaniaAndorraAntigua and BarbudaArab WorldArgentinaArmeniaArubaAustraliaAustriaAzerbaijanBahamas, TheBahrainBangladeshBarbadosBelarusBelgiumBelizeBeninBermudaBhutanBoliviaBosnia and HerzegovinaBotswanaBrazilBrunei DarussalamBurkina FasoBurundiCambodiaCameroonCanadaCaribbean small statesCentral African RepublicCentral Europe and the BalticsChadChileChinaColombiaComorosCongo, Dem. Rep.Congo, Rep.Costa RicaCote d'IvoireCroatiaCubaCyprusCzech RepublicDenmarkDominicaDominican RepublicEarly-demographic dividendEast Asia & PacificEast Asia & Pacific (excluding high income)East Asia & Pacific (IDA & IBRD countries)EcuadorEgypt, Arab Rep.El SalvadorEquatorial GuineaEstoniaEthiopiaEuro areaEurope & Central AsiaEurope & Central Asia (excluding high income)Europe & Central Asia (IDA & IBRD countries)European UnionFaroe IslandsFijiFinlandFragile and conflict affected situationsFranceGabonGambia, TheGeorgiaGermanyGhanaGreeceGrenadaGuatemalaGuineaGuyanaHeavily indebted poor countries (HIPC)High incomeHondurasHong Kong SAR, ChinaHungaryIBRD onlyIcelandIDA & IBRD totalIDA blendIDA onlyIDA totalIndiaIndonesiaIran, Islamic Rep.IraqIrelandItalyJamaicaJapanJordanKazakhstanKenyaKiribatiKorea, Rep.KosovoKuwaitKyrgyz RepublicLao PDRLate-demographic dividendLatin America & Caribbean Latin America & Caribbean (excluding high income)Latin America & the Caribbean (IDA & IBRD countries)LatviaLeast developed countries: UN classificationLebanonLesothoLiberiaLithuaniaLow & middle incomeLow incomeLower middle incomeLuxembourgMacao SAR, ChinaMacedonia, FYRMalawiMalaysiaMaldivesMaltaMarshall IslandsMauritaniaMauritiusMexicoMicronesia, Fed. Sts.Middle East & North AfricaMiddle East & North Africa (excluding high income)Middle East & North Africa (IDA & IBRD countries)Middle incomeMoldovaMongoliaMontenegroMoroccoMozambiqueMyanmarNamibiaNepalNetherlandsNew ZealandNicaraguaNigerNigeriaNorth AmericaNorwayOECD membersOmanOther small statesPacific island small statesPakistanPalauPanamaParaguayPeruPhilippinesPolandPortugalPost-demographic dividendPre-demographic dividendPuerto RicoQatarRomaniaRussian FederationRwandaSamoaSao Tome and PrincipeSaudi ArabiaSenegalSerbiaSeychellesSierra LeoneSingaporeSlovak RepublicSloveniaSmall statesSouth AfricaSouth AsiaSouth Asia (IDA & IBRD)SpainSri LankaSt. Kitts and NevisSt. LuciaSt. Vincent and the GrenadinesSub-Saharan Africa Sub-Saharan Africa (excluding high income)Sub-Saharan Africa (IDA & IBRD countries)SudanSurinameSwazilandSwedenSwitzerlandTajikistanTanzaniaThailandTimor-LesteTogoTongaTrinidad and TobagoTunisiaTurkeyTuvaluUgandaUkraineUnited Arab EmiratesUnited KingdomUnited StatesUpper middle incomeUruguayUzbekistanVanuatuVenezuela, RBVietnamWest Bank and GazaWorldYemen, Rep.ZambiaZimbabwe Timeline:
This timeline shows a graph from 1969 to 2016 of Saudi Arabia. No data until 1968. Number of actual observations by date: 48.
Source name:
World Development Indicators
Source organization:
World Bank national accounts data, and OECD National Accounts data files.
Categories, topics:
Economy & Growth
Last updated:
apr 23, 2017
Indicators value changes by year
Minimum:
3.168 bln
jan 1, 1969
Maximum:
78.97 bln
jan 1, 2016
At the date of observation
Value
Absolute change
Change from previous value
jan 1, 1969
3.168 bln
+3.168 bln
0.0%
jan 1, 1970
3.418 bln
+250.434 mln
7.91%
jan 1, 1971
4.246 bln
+827.791 mln
24.22%
jan 1, 1972
4.343 bln
+97.46 mln
2.3%
jan 1, 1973
4.598 bln
+254.547 mln
5.86%
jan 1, 1974
5.008 bln
+409.989 mln
8.92%
jan 1, 1975
6.258 bln
+1.251 bln
24.97%
jan 1, 1976
6.245 bln
-13.571 mln
-0.22%
jan 1, 1977
6.599 bln
+354.062 mln
5.67%
jan 1, 1978
7.135 bln
+536.234 mln
8.13%
jan 1, 1979
7.745 bln
+610.254 mln
8.55%
jan 1, 1980
8.544 bln
+798.595 mln
10.31%
jan 1, 1981
9.08 bln
+536.233 mln
6.28%
jan 1, 1982
10.126 bln
+1.046 bln
11.52%
jan 1, 1983
11.029 bln
+903.455 mln
8.92%
jan 1, 1984
11.885 bln
+855.755 mln
7.76%
jan 1, 1985
13.303 bln
+1.418 bln
11.93%
jan 1, 1986
14.625 bln
+1.322 bln
9.94%
jan 1, 1987
15.396 bln
+770.632 mln
5.27%
jan 1, 1988
15.435 bln
+39.066 mln
0.25%
jan 1, 1989
16.013 bln
+578.179 mln
3.75%
jan 1, 1990
15.897 bln
-116.376 mln
-0.73%
jan 1, 1991
16.679 bln
+782.557 mln
4.92%
jan 1, 1992
16.733 bln
+54.28 mln
0.33%
jan 1, 1993
17.348 bln
+614.779 mln
3.67%
jan 1, 1994
18.0 bln
+651.786 mln
3.76%
jan 1, 1995
18.965 bln
+965.139 mln
5.36%
jan 1, 1996
20.278 bln
+1.313 bln
6.92%
jan 1, 1997
23.139 bln
+2.86 bln
14.11%
jan 1, 1998
24.196 bln
+1.057 bln
4.57%
jan 1, 1999
24.752 bln
+555.973 mln
2.3%
jan 1, 2000
25.825 bln
+1.073 bln
4.33%
jan 1, 2001
27.056 bln
+1.231 bln
4.77%
jan 1, 2002
28.251 bln
+1.195 bln
4.42%
jan 1, 2003
29.231 bln
+979.532 mln
3.47%
jan 1, 2004
31.311 bln
+2.081 bln
7.12%
jan 1, 2005
35.558 bln
+4.247 bln
13.56%
jan 1, 2006
38.272 bln
+2.714 bln
7.63%
jan 1, 2007
42.15 bln
+3.878 bln
10.13%
jan 1, 2008
46.598 bln
+4.447 bln
10.55%
jan 1, 2009
51.482 bln
+4.885 bln
10.48%
jan 1, 2010
52.826 bln
+1.344 bln
2.61%
jan 1, 2011
58.179 bln
+5.352 bln
10.13%
jan 1, 2012
63.359 bln
+5.18 bln
8.9%
jan 1, 2013
65.938 bln
+2.579 bln
4.07%
jan 1, 2014
68.161 bln
+2.222 bln
3.37%
jan 1, 2015
74.663 bln
+6.502 bln
9.54%
jan 1, 2016
78.97 bln
+4.307 bln
5.77%
Ranking of countries by current statistics by years


Comments: