29
/
en
AIzaSyAYiBZKx7MnpbEhh9jyipgxe19OcubqV5w
April 1, 2024
177905
Lesotho
LSO
true
2
1
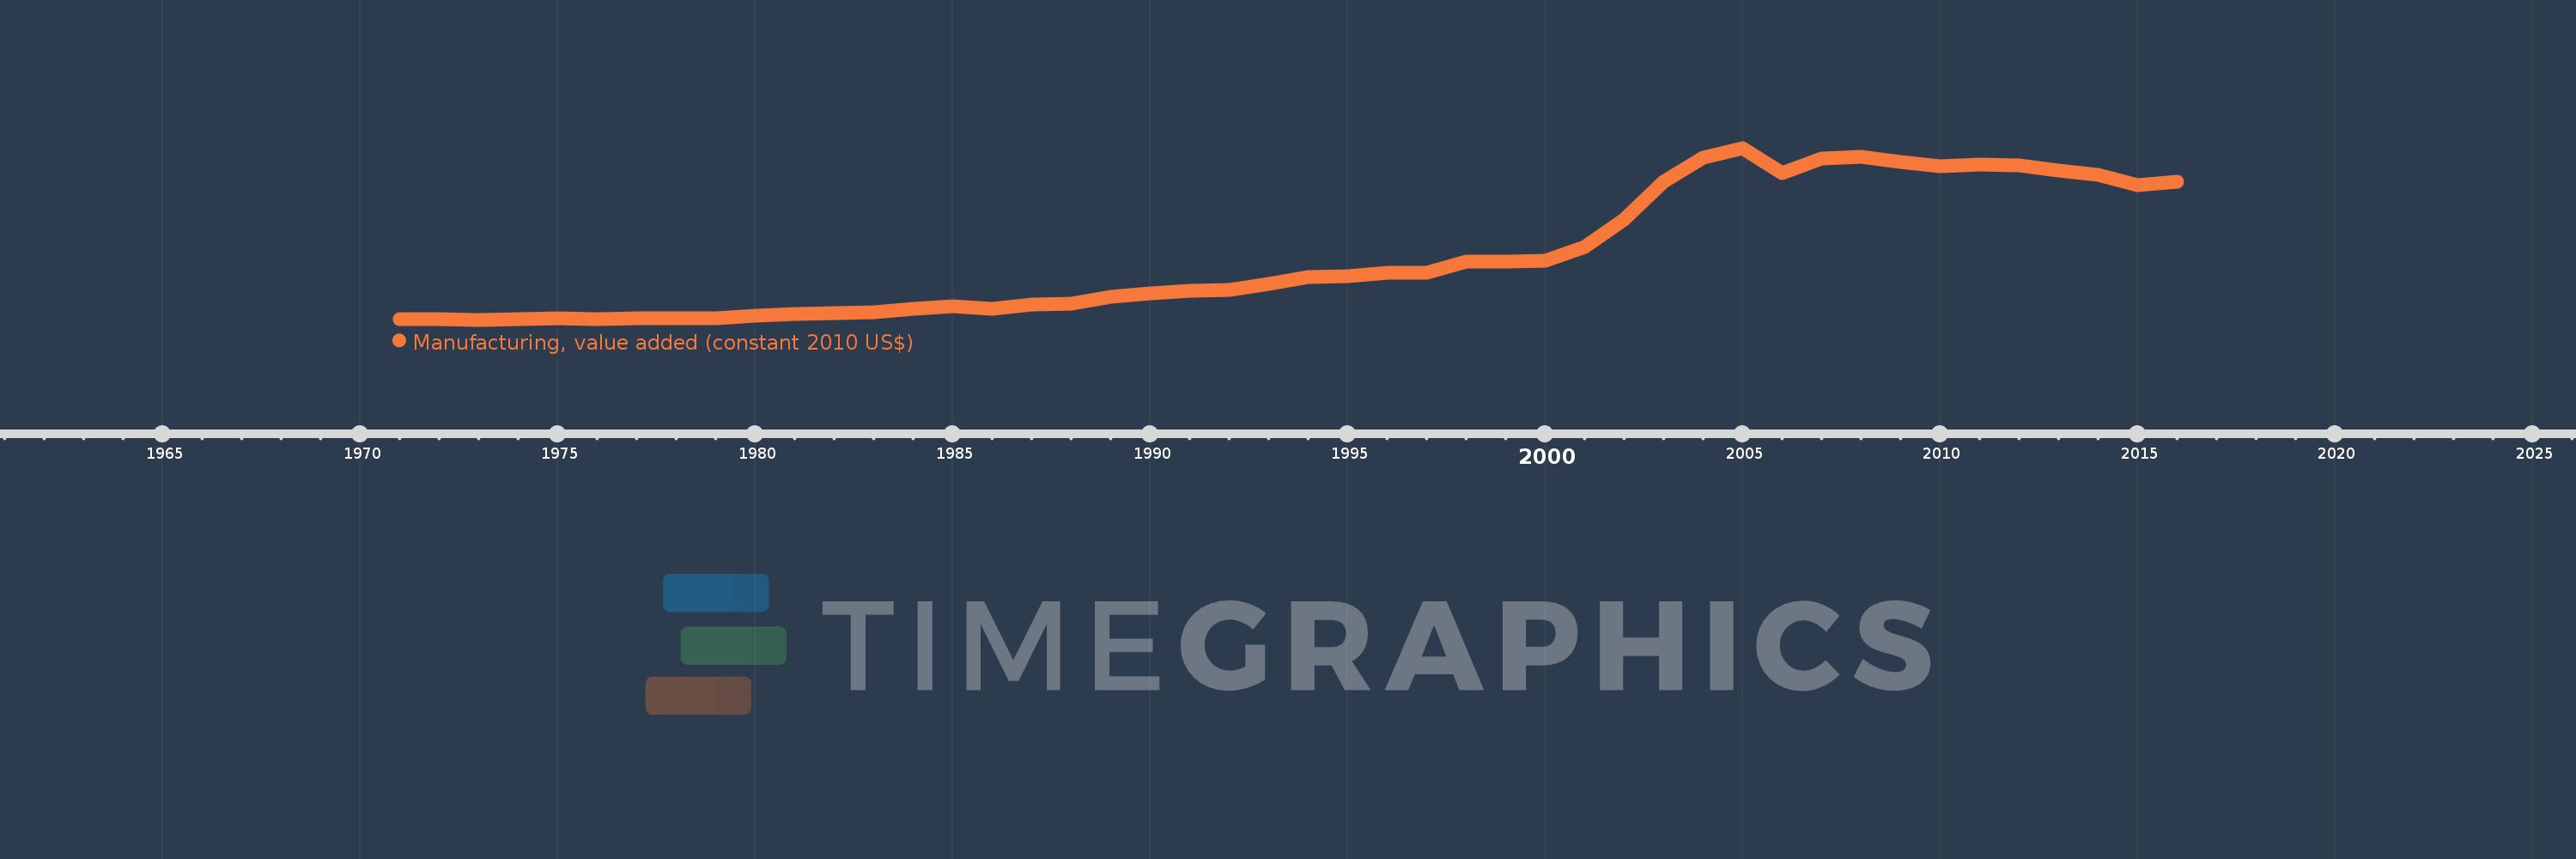
Manufacturing, value added (constant 2010 US$)
2016,2015,2014,2013,2012,2011,2010,2009,2008,2007,2006,2005,2004,2003,2002,2001,2000,1999,1998,1997,1996,1995,1994,1993,1992,1991,1990,1989,1988,1987,1986,1985,1984,1983,1982,1981,1980,1979,1978,1977,1976,1975,1974,1973,1972,1971
This statistics in other country:
AfghanistanAlbaniaAndorraAntigua and BarbudaArab WorldArgentinaArmeniaArubaAustraliaAustriaAzerbaijanBahamas, TheBahrainBangladeshBarbadosBelarusBelgiumBelizeBeninBermudaBhutanBoliviaBosnia and HerzegovinaBotswanaBrazilBrunei DarussalamBurkina FasoBurundiCambodiaCameroonCanadaCaribbean small statesCentral African RepublicCentral Europe and the BalticsChadChileChinaColombiaComorosCongo, Dem. Rep.Congo, Rep.Costa RicaCote d'IvoireCroatiaCubaCyprusCzech RepublicDenmarkDominicaDominican RepublicEarly-demographic dividendEast Asia & PacificEast Asia & Pacific (excluding high income)East Asia & Pacific (IDA & IBRD countries)EcuadorEgypt, Arab Rep.El SalvadorEquatorial GuineaEstoniaEthiopiaEuro areaEurope & Central AsiaEurope & Central Asia (excluding high income)Europe & Central Asia (IDA & IBRD countries)European UnionFaroe IslandsFijiFinlandFragile and conflict affected situationsFranceGabonGambia, TheGeorgiaGermanyGhanaGreeceGrenadaGuatemalaGuineaGuyanaHeavily indebted poor countries (HIPC)High incomeHondurasHong Kong SAR, ChinaHungaryIBRD onlyIcelandIDA & IBRD totalIDA blendIDA onlyIDA totalIndiaIndonesiaIran, Islamic Rep.IraqIrelandItalyJamaicaJapanJordanKazakhstanKenyaKiribatiKorea, Rep.KosovoKuwaitKyrgyz RepublicLao PDRLate-demographic dividendLatin America & Caribbean Latin America & Caribbean (excluding high income)Latin America & the Caribbean (IDA & IBRD countries)LatviaLeast developed countries: UN classificationLebanonLesothoLiberiaLithuaniaLow & middle incomeLow incomeLower middle incomeLuxembourgMacao SAR, ChinaMacedonia, FYRMalawiMalaysiaMaldivesMaltaMarshall IslandsMauritaniaMauritiusMexicoMicronesia, Fed. Sts.Middle East & North AfricaMiddle East & North Africa (excluding high income)Middle East & North Africa (IDA & IBRD countries)Middle incomeMoldovaMongoliaMontenegroMoroccoMozambiqueMyanmarNamibiaNepalNetherlandsNew ZealandNicaraguaNigerNigeriaNorth AmericaNorwayOECD membersOmanOther small statesPacific island small statesPakistanPalauPanamaParaguayPeruPhilippinesPolandPortugalPost-demographic dividendPre-demographic dividendPuerto RicoQatarRomaniaRussian FederationRwandaSamoaSao Tome and PrincipeSaudi ArabiaSenegalSerbiaSeychellesSierra LeoneSingaporeSlovak RepublicSloveniaSmall statesSouth AfricaSouth AsiaSouth Asia (IDA & IBRD)SpainSri LankaSt. Kitts and NevisSt. LuciaSt. Vincent and the GrenadinesSub-Saharan Africa Sub-Saharan Africa (excluding high income)Sub-Saharan Africa (IDA & IBRD countries)SudanSurinameSwazilandSwedenSwitzerlandTajikistanTanzaniaThailandTimor-LesteTogoTongaTrinidad and TobagoTunisiaTurkeyTuvaluUgandaUkraineUnited Arab EmiratesUnited KingdomUnited StatesUpper middle incomeUruguayUzbekistanVanuatuVenezuela, RBVietnamWest Bank and GazaWorldYemen, Rep.ZambiaZimbabwe Timeline:
This timeline shows a graph from 1971 to 2016 of Lesotho. No data until 1970. Number of actual observations by date: 46.
Source name:
World Development Indicators
Source organization:
World Bank national accounts data, and OECD National Accounts data files.
Categories, topics:
Economy & Growth
Last updated:
apr 23, 2017
Indicators value changes by year
Minimum:
10.666 mln
jan 1, 1973
Maximum:
320.307 mln
jan 1, 2005
At the date of observation
Value
Absolute change
Change from previous value
jan 1, 1971
11.29 mln
+11.29 mln
0.0%
jan 1, 1972
11.718 mln
+428.313K
3.79%
jan 1, 1973
10.666 mln
-1.053 mln
-8.98%
jan 1, 1974
12.317 mln
+1.652 mln
15.48%
jan 1, 1975
13.042 mln
+724.578K
5.88%
jan 1, 1976
11.955 mln
-1.087 mln
-8.33%
jan 1, 1977
13.766 mln
+1.811 mln
15.15%
jan 1, 1978
13.042 mln
-724.578K
-5.26%
jan 1, 1979
13.404 mln
+362.484K
2.78%
jan 1, 1980
18.113 mln
+4.709 mln
35.13%
jan 1, 1981
21.142 mln
+3.029 mln
16.72%
jan 1, 1982
22.495 mln
+1.353 mln
6.4%
jan 1, 1983
24.334 mln
+1.839 mln
8.18%
jan 1, 1984
31.008 mln
+6.674 mln
27.43%
jan 1, 1985
35.285 mln
+4.277 mln
13.79%
jan 1, 1986
31.1 mln
-4.185 mln
-11.86%
jan 1, 1987
38.241 mln
+7.141 mln
22.96%
jan 1, 1988
38.88 mln
+639.477K
1.67%
jan 1, 1989
52.378 mln
+13.498 mln
34.72%
jan 1, 1990
57.885 mln
+5.507 mln
10.51%
jan 1, 1991
63.153 mln
+5.268 mln
9.1%
jan 1, 1992
64.416 mln
+1.263 mln
2.0%
jan 1, 1993
75.069 mln
+10.653 mln
16.54%
jan 1, 1994
88.087 mln
+13.019 mln
17.34%
jan 1, 1995
89.506 mln
+1.419 mln
1.61%
jan 1, 1996
95.524 mln
+6.018 mln
6.72%
jan 1, 1997
94.835 mln
-689.517K
-0.72%
jan 1, 1998
114.933 mln
+20.098 mln
21.19%
jan 1, 1999
114.77 mln
-162.393K
-0.14%
jan 1, 2000
116.738 mln
+1.968 mln
1.71%
jan 1, 2001
142.321 mln
+25.583 mln
21.91%
jan 1, 2002
190.573 mln
+48.252 mln
33.9%
jan 1, 2003
259.154 mln
+68.581 mln
35.99%
jan 1, 2004
302.048 mln
+42.894 mln
16.55%
jan 1, 2005
320.307 mln
+18.259 mln
6.05%
jan 1, 2006
274.25 mln
-46.057 mln
-14.38%
jan 1, 2007
301.642 mln
+27.392 mln
9.99%
jan 1, 2008
303.609 mln
+1.967 mln
0.65%
jan 1, 2009
295.777 mln
-7.832 mln
-2.58%
jan 1, 2010
287.022 mln
-8.755 mln
-2.96%
jan 1, 2011
289.867 mln
+2.845 mln
0.99%
jan 1, 2012
288.273 mln
-1.594 mln
-0.55%
jan 1, 2013
278.817 mln
-9.456 mln
-3.28%
jan 1, 2014
271.846 mln
-6.971 mln
-2.5%
jan 1, 2015
253.152 mln
-18.694 mln
-6.88%
jan 1, 2016
259.191 mln
+6.038 mln
2.39%
Ranking of countries by current statistics by years


Comments: