29
/
en
AIzaSyAYiBZKx7MnpbEhh9jyipgxe19OcubqV5w
April 1, 2024
55693
Pre-demographic dividend
PRE
false
2
1
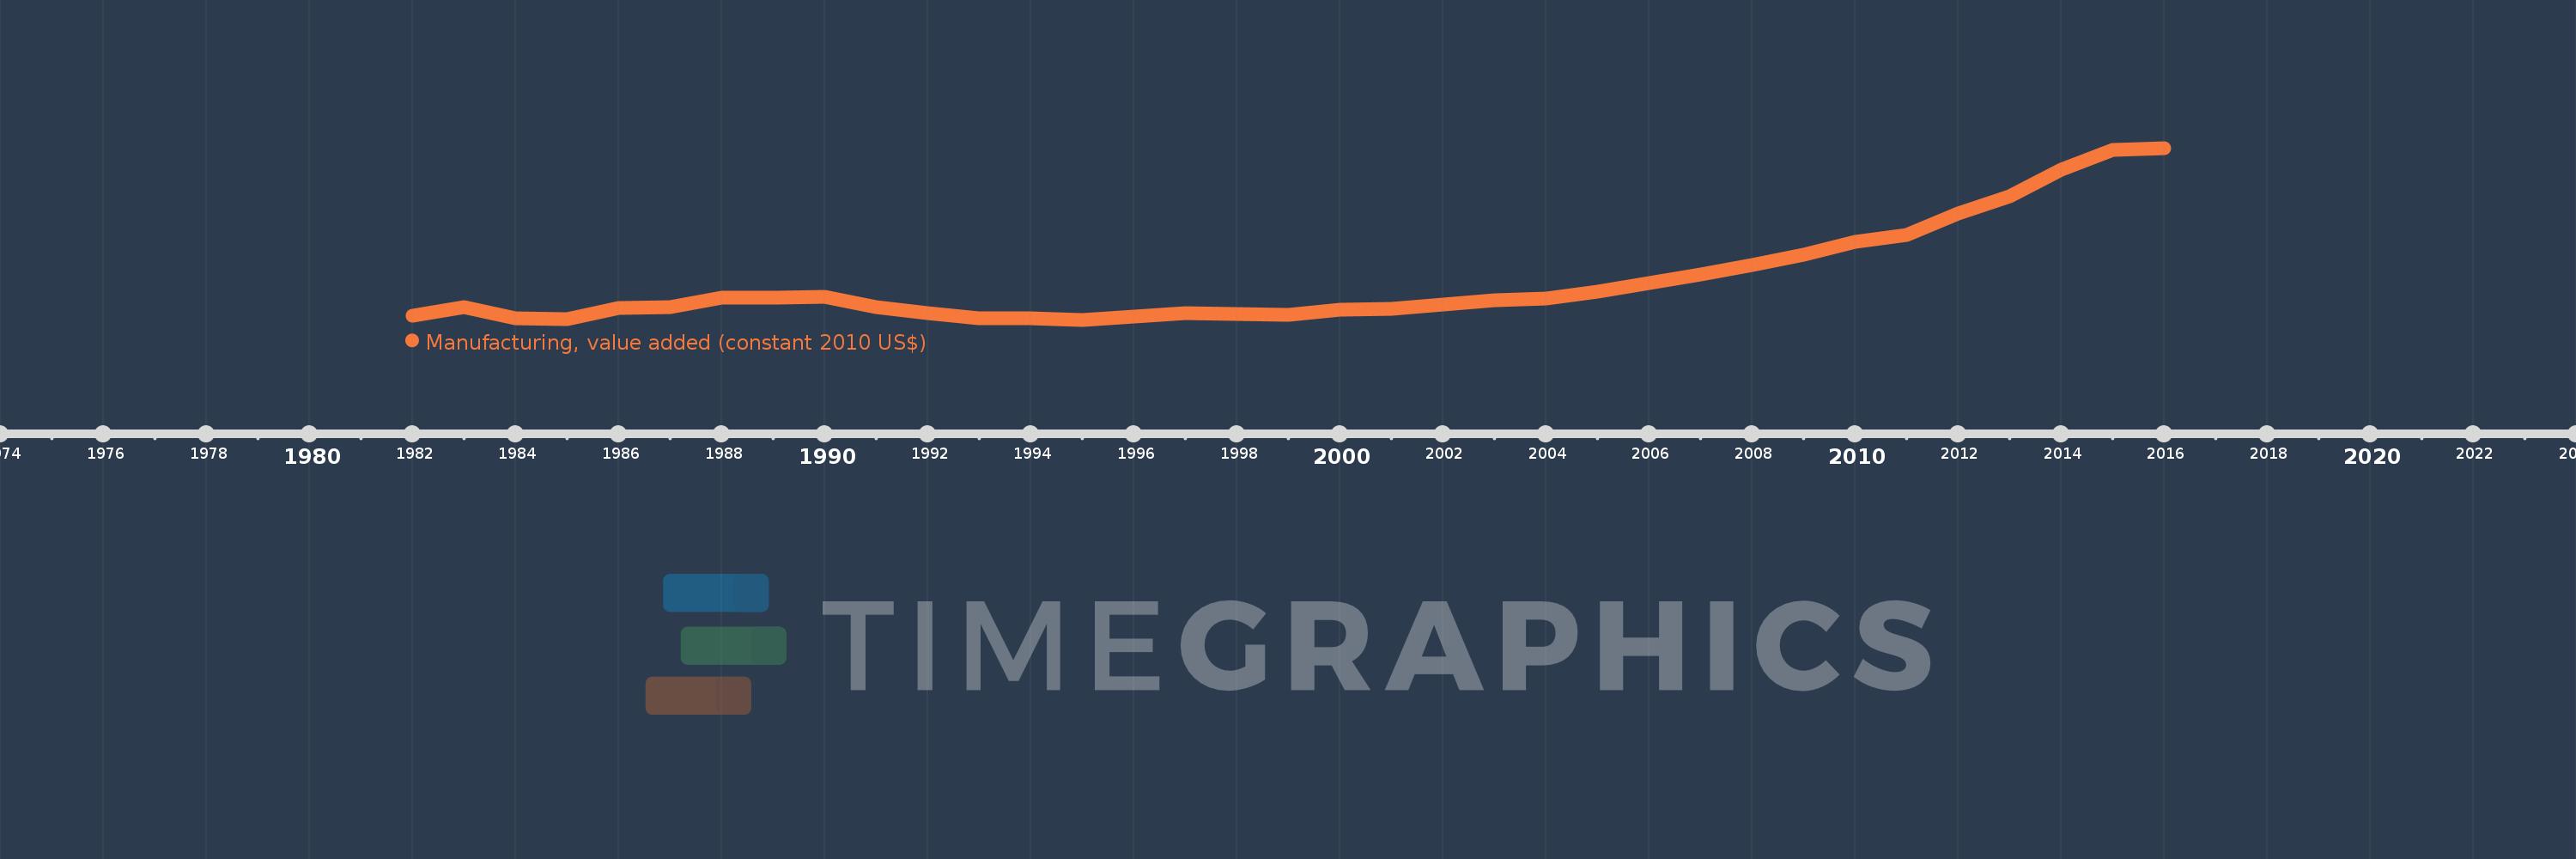
Manufacturing, value added (constant 2010 US$)
2016,2015,2014,2013,2012,2011,2010,2009,2008,2007,2006,2005,2004,2003,2002,2001,2000,1999,1998,1997,1996,1995,1994,1993,1992,1991,1990,1989,1988,1987,1986,1985,1984,1983,1982
This statistics in other country:
AfghanistanAlbaniaAndorraAntigua and BarbudaArab WorldArgentinaArmeniaArubaAustraliaAustriaAzerbaijanBahamas, TheBahrainBangladeshBarbadosBelarusBelgiumBelizeBeninBermudaBhutanBoliviaBosnia and HerzegovinaBotswanaBrazilBrunei DarussalamBurkina FasoBurundiCambodiaCameroonCanadaCaribbean small statesCentral African RepublicCentral Europe and the BalticsChadChileChinaColombiaComorosCongo, Dem. Rep.Congo, Rep.Costa RicaCote d'IvoireCroatiaCubaCyprusCzech RepublicDenmarkDominicaDominican RepublicEarly-demographic dividendEast Asia & PacificEast Asia & Pacific (excluding high income)East Asia & Pacific (IDA & IBRD countries)EcuadorEgypt, Arab Rep.El SalvadorEquatorial GuineaEstoniaEthiopiaEuro areaEurope & Central AsiaEurope & Central Asia (excluding high income)Europe & Central Asia (IDA & IBRD countries)European UnionFaroe IslandsFijiFinlandFragile and conflict affected situationsFranceGabonGambia, TheGeorgiaGermanyGhanaGreeceGrenadaGuatemalaGuineaGuyanaHeavily indebted poor countries (HIPC)High incomeHondurasHong Kong SAR, ChinaHungaryIBRD onlyIcelandIDA & IBRD totalIDA blendIDA onlyIDA totalIndiaIndonesiaIran, Islamic Rep.IraqIrelandItalyJamaicaJapanJordanKazakhstanKenyaKiribatiKorea, Rep.KosovoKuwaitKyrgyz RepublicLao PDRLate-demographic dividendLatin America & Caribbean Latin America & Caribbean (excluding high income)Latin America & the Caribbean (IDA & IBRD countries)LatviaLeast developed countries: UN classificationLebanonLesothoLiberiaLithuaniaLow & middle incomeLow incomeLower middle incomeLuxembourgMacao SAR, ChinaMacedonia, FYRMalawiMalaysiaMaldivesMaltaMarshall IslandsMauritaniaMauritiusMexicoMicronesia, Fed. Sts.Middle East & North AfricaMiddle East & North Africa (excluding high income)Middle East & North Africa (IDA & IBRD countries)Middle incomeMoldovaMongoliaMontenegroMoroccoMozambiqueMyanmarNamibiaNepalNetherlandsNew ZealandNicaraguaNigerNigeriaNorth AmericaNorwayOECD membersOmanOther small statesPacific island small statesPakistanPalauPanamaParaguayPeruPhilippinesPolandPortugalPost-demographic dividendPre-demographic dividendPuerto RicoQatarRomaniaRussian FederationRwandaSamoaSao Tome and PrincipeSaudi ArabiaSenegalSerbiaSeychellesSierra LeoneSingaporeSlovak RepublicSloveniaSmall statesSouth AfricaSouth AsiaSouth Asia (IDA & IBRD)SpainSri LankaSt. Kitts and NevisSt. LuciaSt. Vincent and the GrenadinesSub-Saharan Africa Sub-Saharan Africa (excluding high income)Sub-Saharan Africa (IDA & IBRD countries)SudanSurinameSwazilandSwedenSwitzerlandTajikistanTanzaniaThailandTimor-LesteTogoTongaTrinidad and TobagoTunisiaTurkeyTuvaluUgandaUkraineUnited Arab EmiratesUnited KingdomUnited StatesUpper middle incomeUruguayUzbekistanVanuatuVenezuela, RBVietnamWest Bank and GazaWorldYemen, Rep.ZambiaZimbabwe Timeline:
This timeline shows a graph from 1982 to 2016 of Pre-demographic dividend. No data until 1981. Number of actual observations by date: 35.
Source name:
World Development Indicators
Source organization:
World Bank national accounts data, and OECD National Accounts data files.
Categories, topics:
Economy & Growth
Last updated:
apr 23, 2017
Indicators value changes by year
Minimum:
37.582 bln
jan 1, 1995
Maximum:
102.002 bln
jan 1, 2016
At the date of observation
Value
Absolute change
Change from previous value
jan 1, 1982
39.073 bln
+39.073 bln
0.0%
jan 1, 1983
42.295 bln
+3.222 bln
8.24%
jan 1, 1984
38.133 bln
-4.162 bln
-9.84%
jan 1, 1985
37.799 bln
-334.252 mln
-0.88%
jan 1, 1986
41.996 bln
+4.197 bln
11.1%
jan 1, 1987
42.2 bln
+203.87 mln
0.49%
jan 1, 1988
45.841 bln
+3.641 bln
8.63%
jan 1, 1989
45.996 bln
+154.758 mln
0.34%
jan 1, 1990
46.24 bln
+244.285 mln
0.53%
jan 1, 1991
42.327 bln
-3.914 bln
-8.46%
jan 1, 1992
39.906 bln
-2.421 bln
-5.72%
jan 1, 1993
38.164 bln
-1.742 bln
-4.37%
jan 1, 1994
38.076 bln
-87.921 mln
-0.23%
jan 1, 1995
37.582 bln
-494.096 mln
-1.3%
jan 1, 1996
38.617 bln
+1.035 bln
2.76%
jan 1, 1997
40.062 bln
+1.445 bln
3.74%
jan 1, 1998
39.89 bln
-172.47 mln
-0.43%
jan 1, 1999
39.286 bln
-603.631 mln
-1.51%
jan 1, 2000
41.404 bln
+2.117 bln
5.39%
jan 1, 2001
41.82 bln
+416.508 mln
1.01%
jan 1, 2002
43.175 bln
+1.354 bln
3.24%
jan 1, 2003
44.822 bln
+1.648 bln
3.82%
jan 1, 2004
45.487 bln
+664.85 mln
1.48%
jan 1, 2005
48.029 bln
+2.542 bln
5.59%
jan 1, 2006
51.228 bln
+3.198 bln
6.66%
jan 1, 2007
54.457 bln
+3.229 bln
6.3%
jan 1, 2008
58.241 bln
+3.784 bln
6.95%
jan 1, 2009
61.837 bln
+3.596 bln
6.17%
jan 1, 2010
66.649 bln
+4.812 bln
7.78%
jan 1, 2011
69.287 bln
+2.639 bln
3.96%
jan 1, 2012
77.317 bln
+8.029 bln
11.59%
jan 1, 2013
83.989 bln
+6.672 bln
8.63%
jan 1, 2014
93.767 bln
+9.778 bln
11.64%
jan 1, 2015
101.391 bln
+7.624 bln
8.13%
jan 1, 2016
102.002 bln
+610.679 mln
0.6%
Ranking of countries by current statistics by years


Comments: