29
/
en
AIzaSyAYiBZKx7MnpbEhh9jyipgxe19OcubqV5w
April 1, 2024
109921
Congo, Dem. Rep.
COD
true
2
1
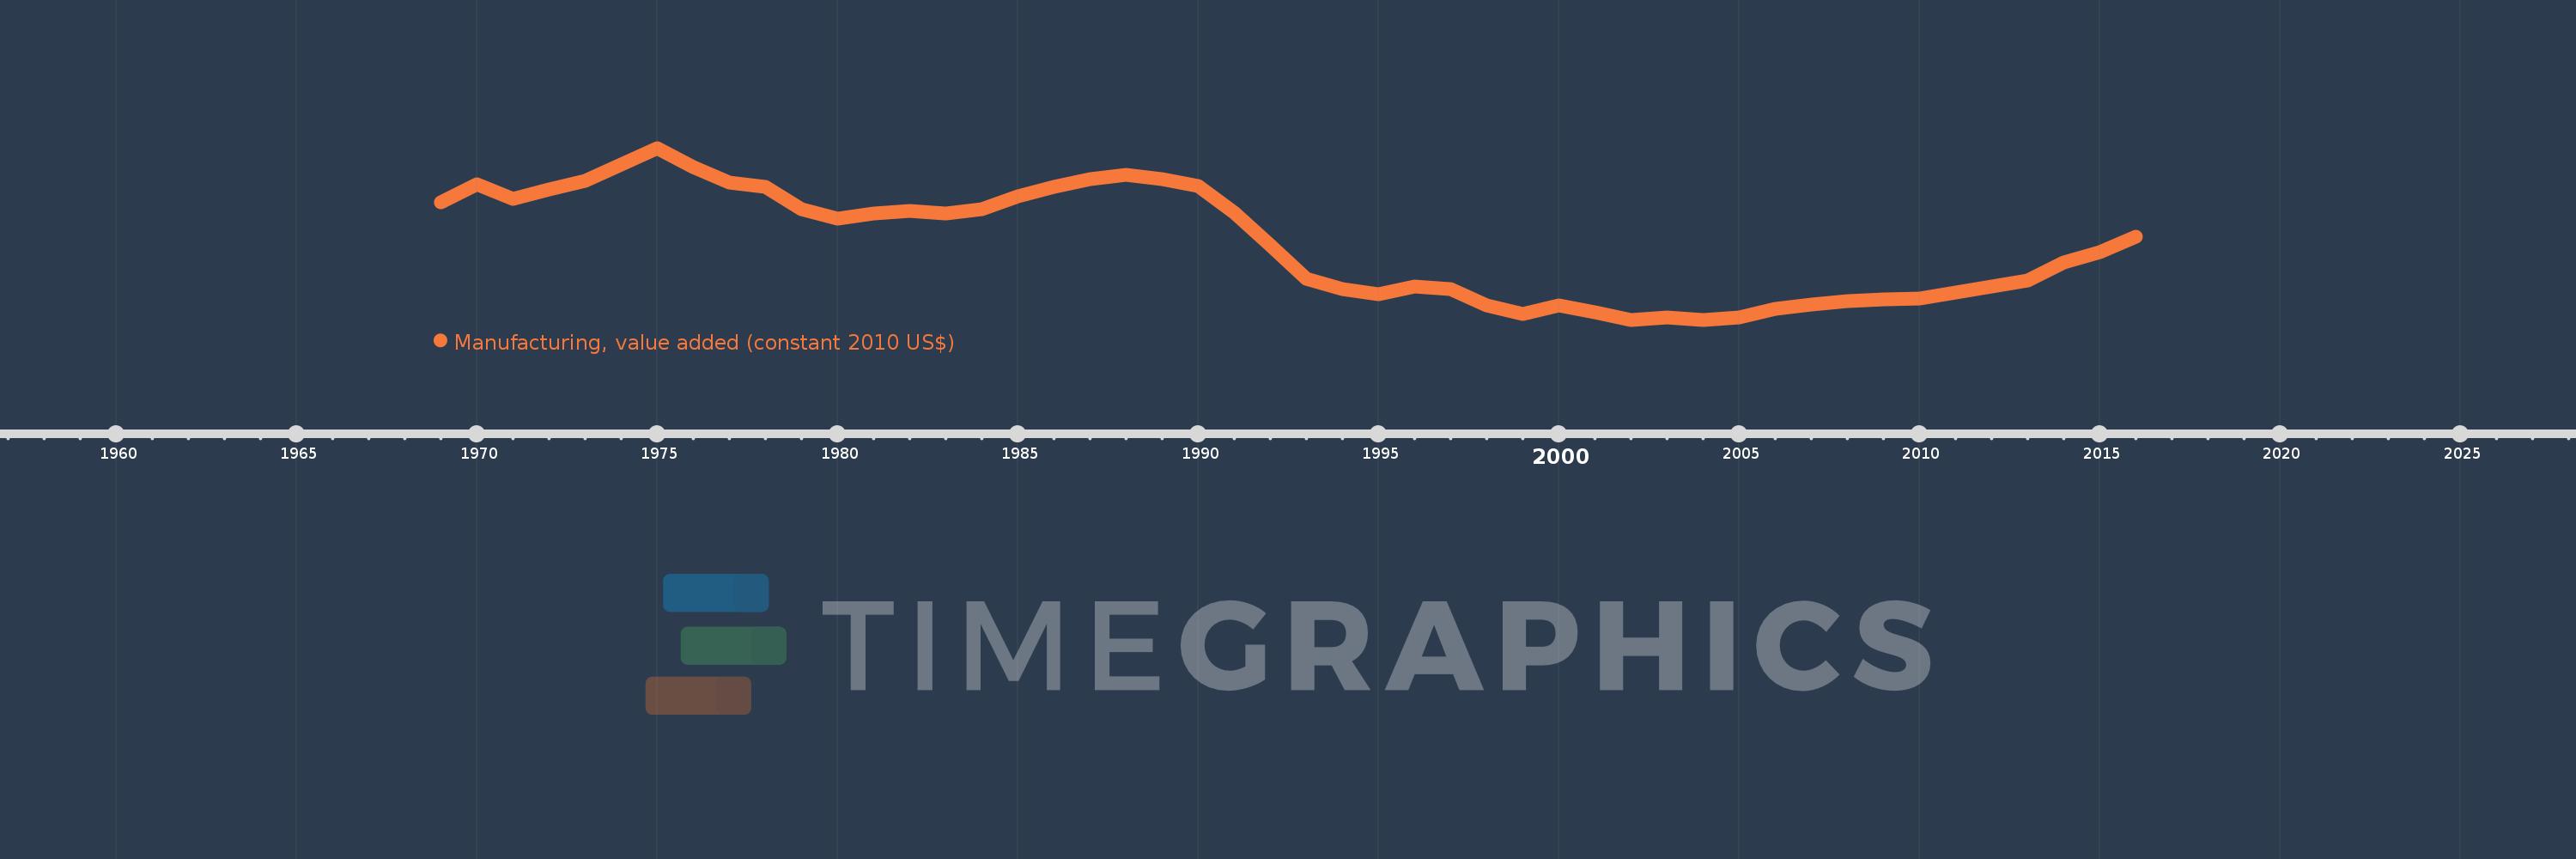
Manufacturing, value added (constant 2010 US$)
2016,2015,2014,2013,2012,2011,2010,2009,2008,2007,2006,2005,2004,2003,2002,2001,2000,1999,1998,1997,1996,1995,1994,1993,1992,1991,1990,1989,1988,1987,1986,1985,1984,1983,1982,1981,1980,1979,1978,1977,1976,1975,1974,1973,1972,1971,1970,1969
This statistics in other country:
AfghanistanAlbaniaAndorraAntigua and BarbudaArab WorldArgentinaArmeniaArubaAustraliaAustriaAzerbaijanBahamas, TheBahrainBangladeshBarbadosBelarusBelgiumBelizeBeninBermudaBhutanBoliviaBosnia and HerzegovinaBotswanaBrazilBrunei DarussalamBurkina FasoBurundiCambodiaCameroonCanadaCaribbean small statesCentral African RepublicCentral Europe and the BalticsChadChileChinaColombiaComorosCongo, Dem. Rep.Congo, Rep.Costa RicaCote d'IvoireCroatiaCubaCyprusCzech RepublicDenmarkDominicaDominican RepublicEarly-demographic dividendEast Asia & PacificEast Asia & Pacific (excluding high income)East Asia & Pacific (IDA & IBRD countries)EcuadorEgypt, Arab Rep.El SalvadorEquatorial GuineaEstoniaEthiopiaEuro areaEurope & Central AsiaEurope & Central Asia (excluding high income)Europe & Central Asia (IDA & IBRD countries)European UnionFaroe IslandsFijiFinlandFragile and conflict affected situationsFranceGabonGambia, TheGeorgiaGermanyGhanaGreeceGrenadaGuatemalaGuineaGuyanaHeavily indebted poor countries (HIPC)High incomeHondurasHong Kong SAR, ChinaHungaryIBRD onlyIcelandIDA & IBRD totalIDA blendIDA onlyIDA totalIndiaIndonesiaIran, Islamic Rep.IraqIrelandItalyJamaicaJapanJordanKazakhstanKenyaKiribatiKorea, Rep.KosovoKuwaitKyrgyz RepublicLao PDRLate-demographic dividendLatin America & Caribbean Latin America & Caribbean (excluding high income)Latin America & the Caribbean (IDA & IBRD countries)LatviaLeast developed countries: UN classificationLebanonLesothoLiberiaLithuaniaLow & middle incomeLow incomeLower middle incomeLuxembourgMacao SAR, ChinaMacedonia, FYRMalawiMalaysiaMaldivesMaltaMarshall IslandsMauritaniaMauritiusMexicoMicronesia, Fed. Sts.Middle East & North AfricaMiddle East & North Africa (excluding high income)Middle East & North Africa (IDA & IBRD countries)Middle incomeMoldovaMongoliaMontenegroMoroccoMozambiqueMyanmarNamibiaNepalNetherlandsNew ZealandNicaraguaNigerNigeriaNorth AmericaNorwayOECD membersOmanOther small statesPacific island small statesPakistanPalauPanamaParaguayPeruPhilippinesPolandPortugalPost-demographic dividendPre-demographic dividendPuerto RicoQatarRomaniaRussian FederationRwandaSamoaSao Tome and PrincipeSaudi ArabiaSenegalSerbiaSeychellesSierra LeoneSingaporeSlovak RepublicSloveniaSmall statesSouth AfricaSouth AsiaSouth Asia (IDA & IBRD)SpainSri LankaSt. Kitts and NevisSt. LuciaSt. Vincent and the GrenadinesSub-Saharan Africa Sub-Saharan Africa (excluding high income)Sub-Saharan Africa (IDA & IBRD countries)SudanSurinameSwazilandSwedenSwitzerlandTajikistanTanzaniaThailandTimor-LesteTogoTongaTrinidad and TobagoTunisiaTurkeyTuvaluUgandaUkraineUnited Arab EmiratesUnited KingdomUnited StatesUpper middle incomeUruguayUzbekistanVanuatuVenezuela, RBVietnamWest Bank and GazaWorldYemen, Rep.ZambiaZimbabwe Timeline:
This timeline shows a graph from 1969 to 2016 of Congo, Dem. Rep.. No data until 1968. Number of actual observations by date: 48.
Source name:
World Development Indicators
Source organization:
World Bank national accounts data, and OECD National Accounts data files.
Categories, topics:
Economy & Growth
Last updated:
apr 23, 2017
Indicators value changes by year
Minimum:
2.184 bln
jan 1, 2004
Maximum:
10.445 bln
jan 1, 1975
At the date of observation
Value
Absolute change
Change from previous value
jan 1, 1969
7.841 bln
+7.841 bln
0.0%
jan 1, 1970
8.678 bln
+836.557 mln
10.67%
jan 1, 1971
8.006 bln
-671.192 mln
-7.73%
jan 1, 1972
8.461 bln
+454.419 mln
5.68%
jan 1, 1973
8.864 bln
+402.934 mln
4.76%
jan 1, 1974
9.649 bln
+785.186 mln
8.86%
jan 1, 1975
10.445 bln
+795.609 mln
8.25%
jan 1, 1976
9.515 bln
-929.648 mln
-8.9%
jan 1, 1977
8.76 bln
-754.709 mln
-7.93%
jan 1, 1978
8.575 bln
-185.43 mln
-2.12%
jan 1, 1979
7.489 bln
-1.085 bln
-12.66%
jan 1, 1980
7.056 bln
-433.469 mln
-5.79%
jan 1, 1981
7.304 bln
+248.071 mln
3.52%
jan 1, 1982
7.417 bln
+113.178 mln
1.55%
jan 1, 1983
7.304 bln
-113.06 mln
-1.52%
jan 1, 1984
7.515 bln
+210.805 mln
2.89%
jan 1, 1985
8.115 bln
+600.232 mln
7.99%
jan 1, 1986
8.585 bln
+470.27 mln
5.79%
jan 1, 1987
8.952 bln
+366.737 mln
4.27%
jan 1, 1988
9.167 bln
+214.552 mln
2.4%
jan 1, 1989
8.962 bln
-205.028 mln
-2.24%
jan 1, 1990
8.596 bln
-365.941 mln
-4.08%
jan 1, 1991
7.337 bln
-1.259 bln
-14.64%
jan 1, 1992
5.761 bln
-1.576 bln
-21.48%
jan 1, 1993
4.173 bln
-1.588 bln
-27.56%
jan 1, 1994
3.663 bln
-510.301 mln
-12.23%
jan 1, 1995
3.391 bln
-272.16 mln
-7.43%
jan 1, 1996
3.776 bln
+385.561 mln
11.37%
jan 1, 1997
3.67 bln
-105.734 mln
-2.8%
jan 1, 1998
2.87 bln
-800.168 mln
-21.8%
jan 1, 1999
2.457 bln
-413.327 mln
-14.4%
jan 1, 2000
2.865 bln
+407.862 mln
16.6%
jan 1, 2001
2.553 bln
-312.27 mln
-10.9%
jan 1, 2002
2.192 bln
-360.861 mln
-14.14%
jan 1, 2003
2.286 bln
+94.458 mln
4.31%
jan 1, 2004
2.184 bln
-102.084 mln
-4.47%
jan 1, 2005
2.278 bln
+94.212 mln
4.31%
jan 1, 2006
2.693 bln
+414.24 mln
18.18%
jan 1, 2007
2.914 bln
+221.387 mln
8.22%
jan 1, 2008
3.063 bln
+148.575 mln
5.1%
jan 1, 2009
3.145 bln
+82.651 mln
2.7%
jan 1, 2010
3.205 bln
+60.02 mln
1.91%
jan 1, 2011
3.498 bln
+293.157 mln
9.15%
jan 1, 2012
3.767 bln
+268.868 mln
7.69%
jan 1, 2013
4.064 bln
+296.386 mln
7.87%
jan 1, 2014
4.934 bln
+870.234 mln
21.42%
jan 1, 2015
5.424 bln
+490.205 mln
9.94%
jan 1, 2016
6.169 bln
+744.847 mln
13.73%
Ranking of countries by current statistics by years


Comments: