29
/
en
AIzaSyAYiBZKx7MnpbEhh9jyipgxe19OcubqV5w
April 1, 2024
209532
New Zealand
NZL
true
2
1
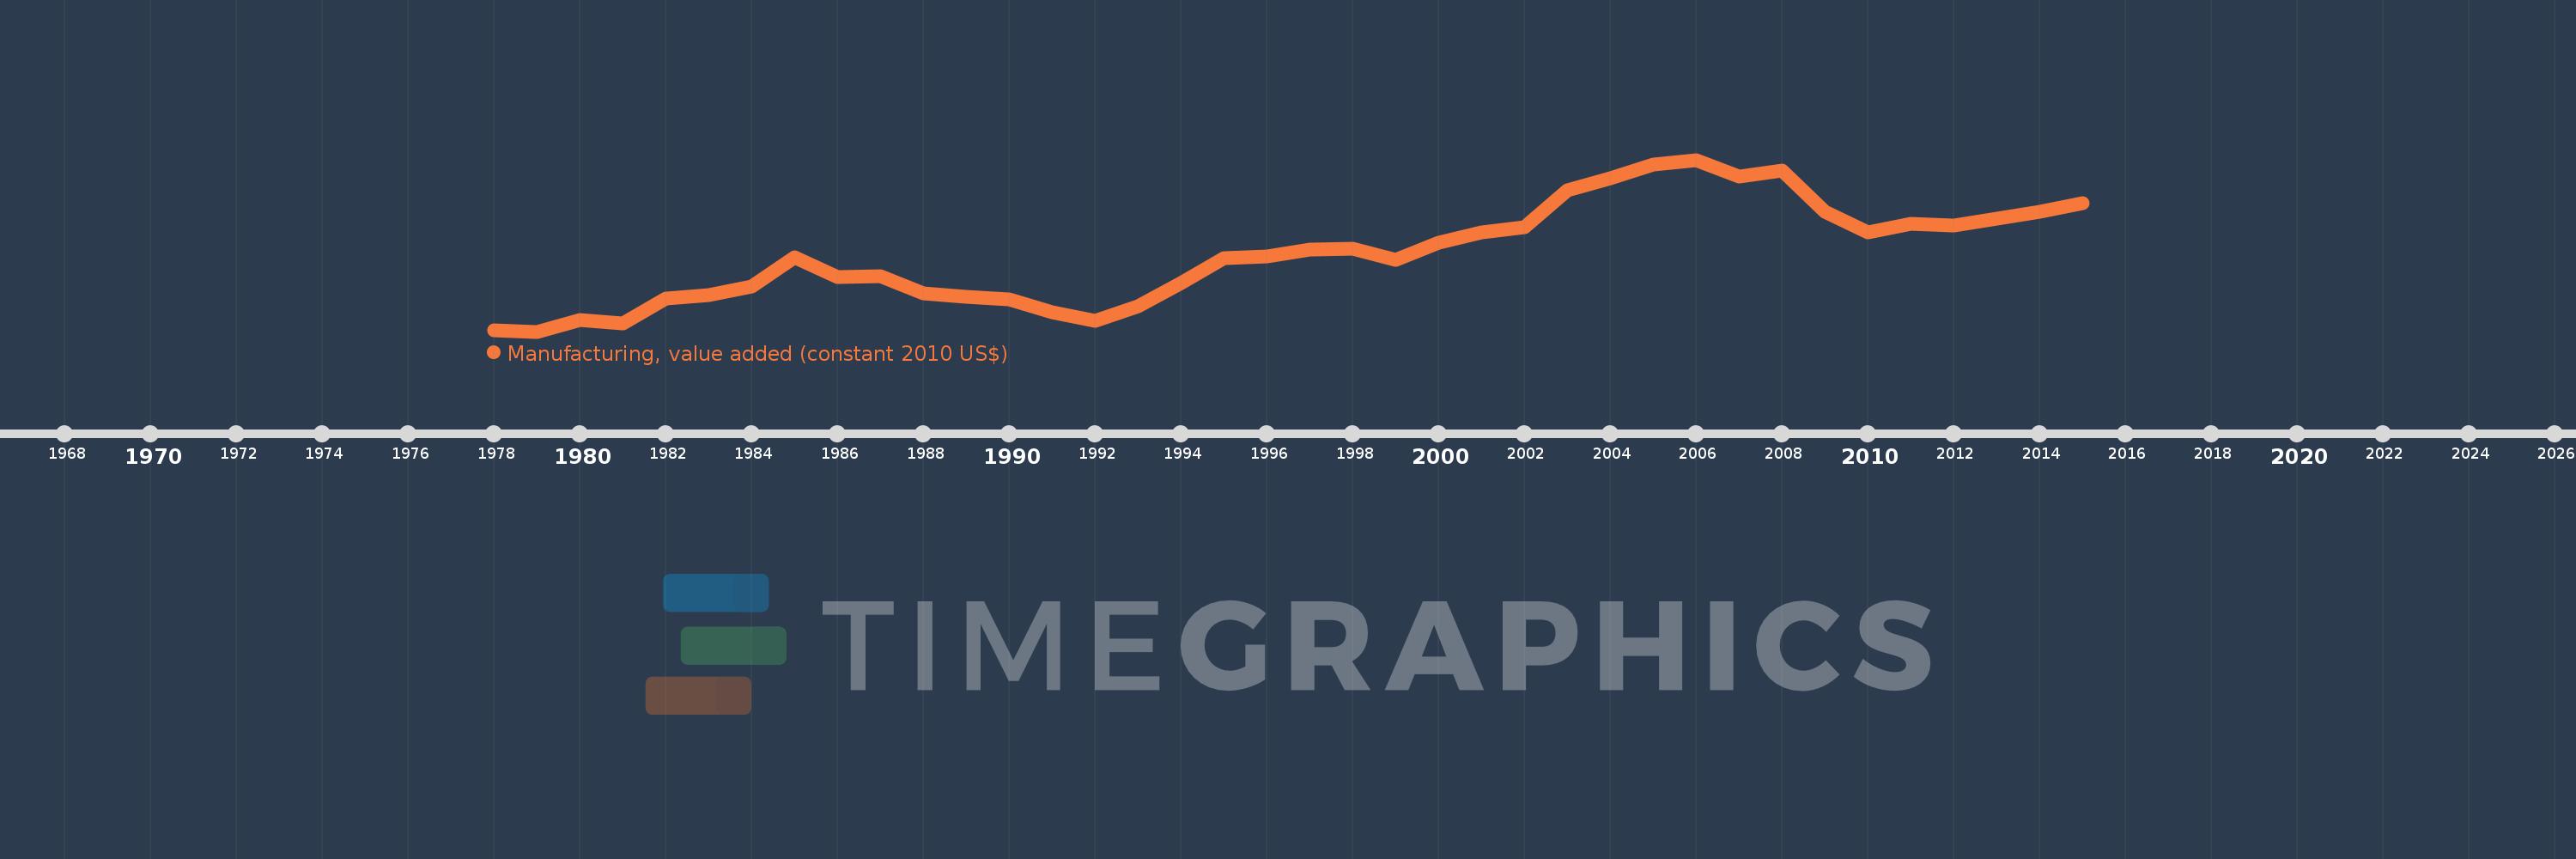
Manufacturing, value added (constant 2010 US$)
2015,2014,2013,2012,2011,2010,2009,2008,2007,2006,2005,2004,2003,2002,2001,2000,1999,1998,1997,1996,1995,1994,1993,1992,1991,1990,1989,1988,1987,1986,1985,1984,1983,1982,1981,1980,1979,1978
This statistics in other country:
AfghanistanAlbaniaAndorraAntigua and BarbudaArab WorldArgentinaArmeniaArubaAustraliaAustriaAzerbaijanBahamas, TheBahrainBangladeshBarbadosBelarusBelgiumBelizeBeninBermudaBhutanBoliviaBosnia and HerzegovinaBotswanaBrazilBrunei DarussalamBurkina FasoBurundiCambodiaCameroonCanadaCaribbean small statesCentral African RepublicCentral Europe and the BalticsChadChileChinaColombiaComorosCongo, Dem. Rep.Congo, Rep.Costa RicaCote d'IvoireCroatiaCubaCyprusCzech RepublicDenmarkDominicaDominican RepublicEarly-demographic dividendEast Asia & PacificEast Asia & Pacific (excluding high income)East Asia & Pacific (IDA & IBRD countries)EcuadorEgypt, Arab Rep.El SalvadorEquatorial GuineaEstoniaEthiopiaEuro areaEurope & Central AsiaEurope & Central Asia (excluding high income)Europe & Central Asia (IDA & IBRD countries)European UnionFaroe IslandsFijiFinlandFragile and conflict affected situationsFranceGabonGambia, TheGeorgiaGermanyGhanaGreeceGrenadaGuatemalaGuineaGuyanaHeavily indebted poor countries (HIPC)High incomeHondurasHong Kong SAR, ChinaHungaryIBRD onlyIcelandIDA & IBRD totalIDA blendIDA onlyIDA totalIndiaIndonesiaIran, Islamic Rep.IraqIrelandItalyJamaicaJapanJordanKazakhstanKenyaKiribatiKorea, Rep.KosovoKuwaitKyrgyz RepublicLao PDRLate-demographic dividendLatin America & Caribbean Latin America & Caribbean (excluding high income)Latin America & the Caribbean (IDA & IBRD countries)LatviaLeast developed countries: UN classificationLebanonLesothoLiberiaLithuaniaLow & middle incomeLow incomeLower middle incomeLuxembourgMacao SAR, ChinaMacedonia, FYRMalawiMalaysiaMaldivesMaltaMarshall IslandsMauritaniaMauritiusMexicoMicronesia, Fed. Sts.Middle East & North AfricaMiddle East & North Africa (excluding high income)Middle East & North Africa (IDA & IBRD countries)Middle incomeMoldovaMongoliaMontenegroMoroccoMozambiqueMyanmarNamibiaNepalNetherlandsNew ZealandNicaraguaNigerNigeriaNorth AmericaNorwayOECD membersOmanOther small statesPacific island small statesPakistanPalauPanamaParaguayPeruPhilippinesPolandPortugalPost-demographic dividendPre-demographic dividendPuerto RicoQatarRomaniaRussian FederationRwandaSamoaSao Tome and PrincipeSaudi ArabiaSenegalSerbiaSeychellesSierra LeoneSingaporeSlovak RepublicSloveniaSmall statesSouth AfricaSouth AsiaSouth Asia (IDA & IBRD)SpainSri LankaSt. Kitts and NevisSt. LuciaSt. Vincent and the GrenadinesSub-Saharan Africa Sub-Saharan Africa (excluding high income)Sub-Saharan Africa (IDA & IBRD countries)SudanSurinameSwazilandSwedenSwitzerlandTajikistanTanzaniaThailandTimor-LesteTogoTongaTrinidad and TobagoTunisiaTurkeyTuvaluUgandaUkraineUnited Arab EmiratesUnited KingdomUnited StatesUpper middle incomeUruguayUzbekistanVanuatuVenezuela, RBVietnamWest Bank and GazaWorldYemen, Rep.ZambiaZimbabwe Timeline:
This timeline shows a graph from 1978 to 2015 of New Zealand. No data until 1977. Number of actual observations by date: 38.
Source name:
World Development Indicators
Source organization:
World Bank national accounts data, and OECD National Accounts data files.
Categories, topics:
Economy & Growth
Last updated:
apr 23, 2017
Indicators value changes by year
Minimum:
11.881 bln
jan 1, 1979
Maximum:
18.292 bln
jan 1, 2006
At the date of observation
Value
Absolute change
Change from previous value
jan 1, 1978
11.928 bln
+11.928 bln
0.0%
jan 1, 1979
11.881 bln
-46.873 mln
-0.39%
jan 1, 1980
12.323 bln
+441.945 mln
3.72%
jan 1, 1981
12.174 bln
-148.803 mln
-1.21%
jan 1, 1982
13.11 bln
+935.972 mln
7.69%
jan 1, 1983
13.232 bln
+121.275 mln
0.93%
jan 1, 1984
13.58 bln
+348.199 mln
2.63%
jan 1, 1985
14.668 bln
+1.088 bln
8.02%
jan 1, 1986
13.922 bln
-746.248 mln
-5.09%
jan 1, 1987
13.94 bln
+17.856 mln
0.13%
jan 1, 1988
13.293 bln
-646.55 mln
-4.64%
jan 1, 1989
13.186 bln
-107.138 mln
-0.81%
jan 1, 1990
13.078 bln
-107.882 mln
-0.82%
jan 1, 1991
12.59 bln
-488.074 mln
-3.73%
jan 1, 1992
12.278 bln
-311.743 mln
-2.48%
jan 1, 1993
12.829 bln
+550.572 mln
4.48%
jan 1, 1994
13.677 bln
+848.178 mln
6.61%
jan 1, 1995
14.618 bln
+940.436 mln
6.88%
jan 1, 1996
14.7 bln
+82.586 mln
0.56%
jan 1, 1997
14.933 bln
+232.877 mln
1.58%
jan 1, 1998
14.964 bln
+31.249 mln
0.21%
jan 1, 1999
14.554 bln
-410.697 mln
-2.74%
jan 1, 2000
15.193 bln
+639.11 mln
4.39%
jan 1, 2001
15.589 bln
+395.816 mln
2.61%
jan 1, 2002
15.79 bln
+201.628 mln
1.29%
jan 1, 2003
17.169 bln
+1.379 bln
8.73%
jan 1, 2004
17.614 bln
+444.921 mln
2.59%
jan 1, 2005
18.124 bln
+510.395 mln
2.9%
jan 1, 2006
18.292 bln
+168.148 mln
0.93%
jan 1, 2007
17.678 bln
-614.557 mln
-3.36%
jan 1, 2008
17.876 bln
+197.908 mln
1.12%
jan 1, 2009
16.342 bln
-1.534 bln
-8.58%
jan 1, 2010
15.569 bln
-772.288 mln
-4.73%
jan 1, 2011
15.888 bln
+319.183 mln
2.05%
jan 1, 2012
15.855 bln
-33.481 mln
-0.21%
jan 1, 2013
16.084 bln
+229.157 mln
1.45%
jan 1, 2014
16.343 bln
+258.917 mln
1.61%
jan 1, 2015
16.666 bln
+322.903 mln
1.98%
Ranking of countries by current statistics by years


Comments: