29
/
en
AIzaSyAYiBZKx7MnpbEhh9jyipgxe19OcubqV5w
April 1, 2024
188055
Malaysia
MYS
true
2
1
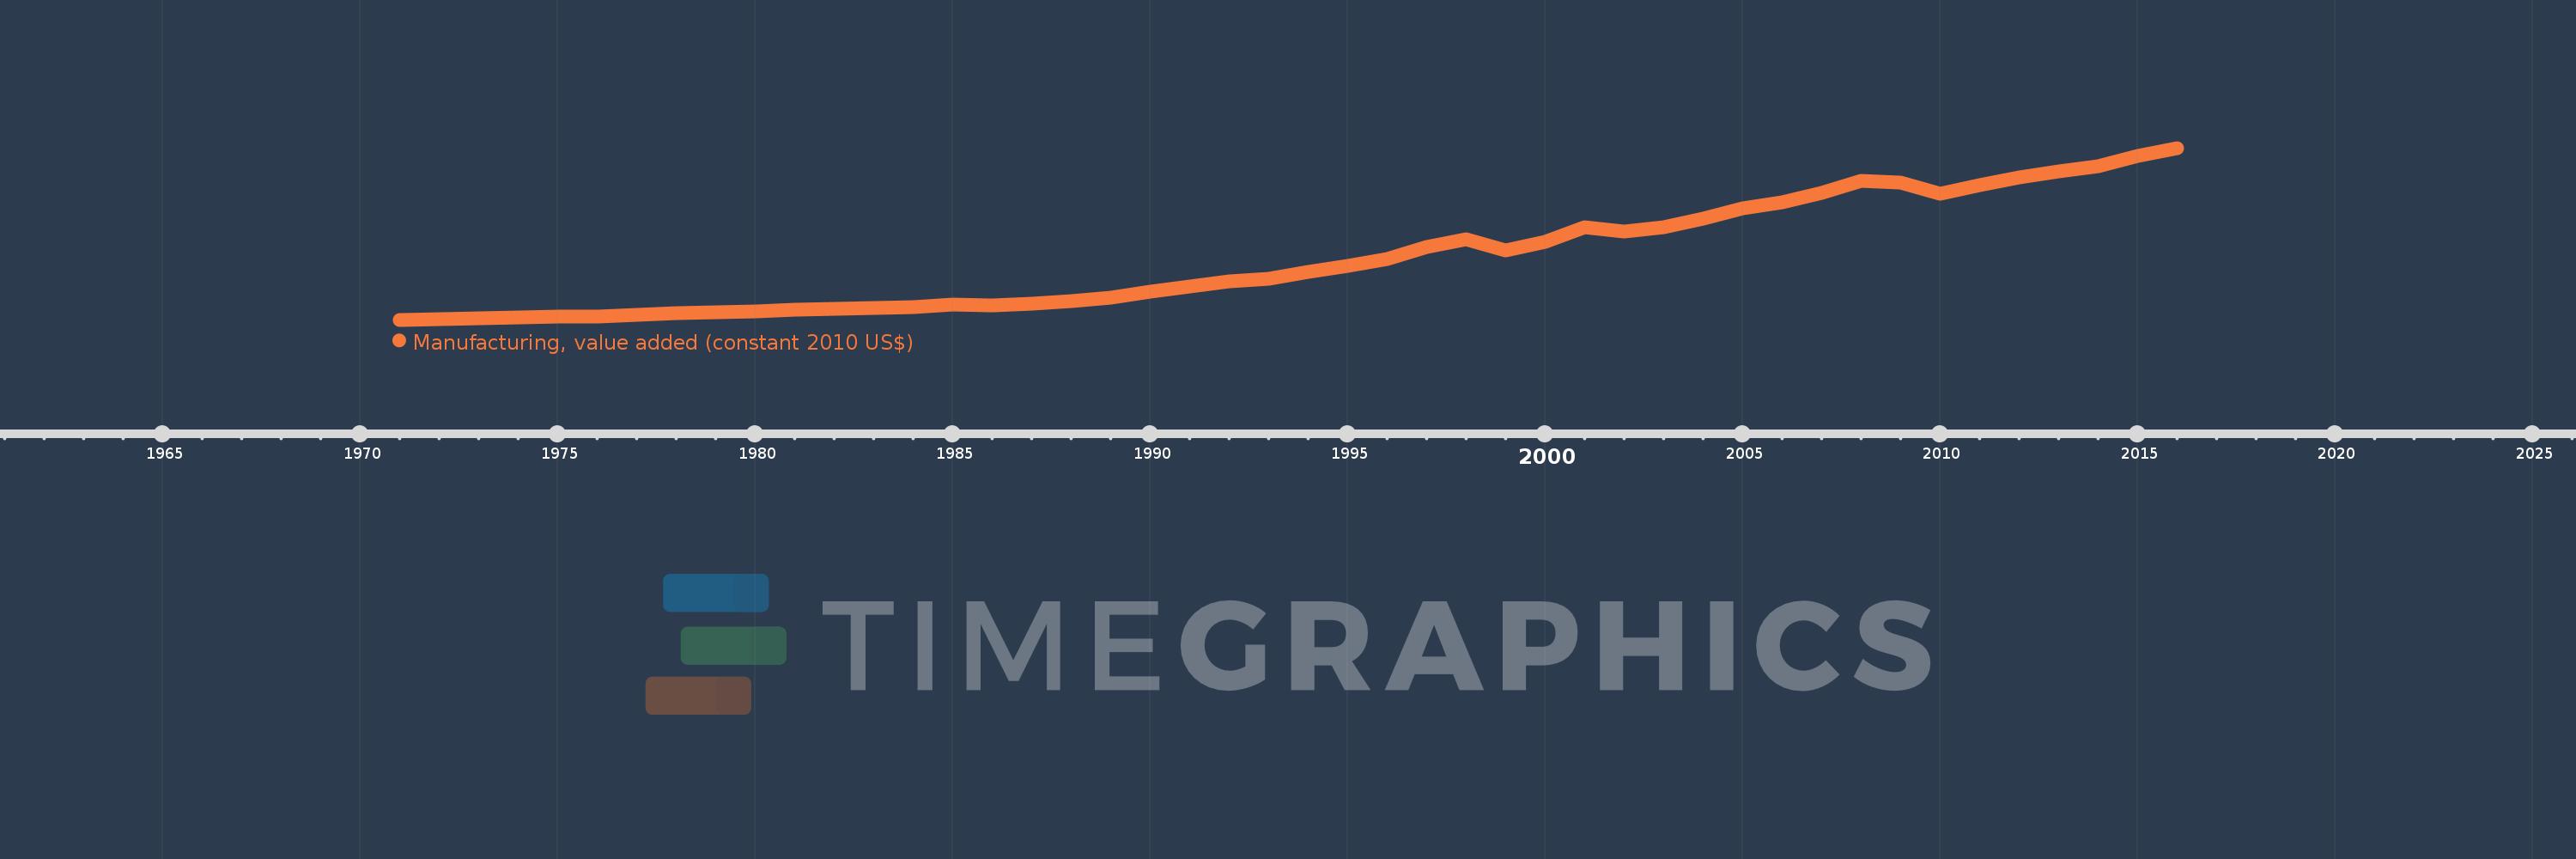
Manufacturing, value added (constant 2010 US$)
2016,2015,2014,2013,2012,2011,2010,2009,2008,2007,2006,2005,2004,2003,2002,2001,2000,1999,1998,1997,1996,1995,1994,1993,1992,1991,1990,1989,1988,1987,1986,1985,1984,1983,1982,1981,1980,1979,1978,1977,1976,1975,1974,1973,1972,1971
This statistics in other country:
AfghanistanAlbaniaAndorraAntigua and BarbudaArab WorldArgentinaArmeniaArubaAustraliaAustriaAzerbaijanBahamas, TheBahrainBangladeshBarbadosBelarusBelgiumBelizeBeninBermudaBhutanBoliviaBosnia and HerzegovinaBotswanaBrazilBrunei DarussalamBurkina FasoBurundiCambodiaCameroonCanadaCaribbean small statesCentral African RepublicCentral Europe and the BalticsChadChileChinaColombiaComorosCongo, Dem. Rep.Congo, Rep.Costa RicaCote d'IvoireCroatiaCubaCyprusCzech RepublicDenmarkDominicaDominican RepublicEarly-demographic dividendEast Asia & PacificEast Asia & Pacific (excluding high income)East Asia & Pacific (IDA & IBRD countries)EcuadorEgypt, Arab Rep.El SalvadorEquatorial GuineaEstoniaEthiopiaEuro areaEurope & Central AsiaEurope & Central Asia (excluding high income)Europe & Central Asia (IDA & IBRD countries)European UnionFaroe IslandsFijiFinlandFragile and conflict affected situationsFranceGabonGambia, TheGeorgiaGermanyGhanaGreeceGrenadaGuatemalaGuineaGuyanaHeavily indebted poor countries (HIPC)High incomeHondurasHong Kong SAR, ChinaHungaryIBRD onlyIcelandIDA & IBRD totalIDA blendIDA onlyIDA totalIndiaIndonesiaIran, Islamic Rep.IraqIrelandItalyJamaicaJapanJordanKazakhstanKenyaKiribatiKorea, Rep.KosovoKuwaitKyrgyz RepublicLao PDRLate-demographic dividendLatin America & Caribbean Latin America & Caribbean (excluding high income)Latin America & the Caribbean (IDA & IBRD countries)LatviaLeast developed countries: UN classificationLebanonLesothoLiberiaLithuaniaLow & middle incomeLow incomeLower middle incomeLuxembourgMacao SAR, ChinaMacedonia, FYRMalawiMalaysiaMaldivesMaltaMarshall IslandsMauritaniaMauritiusMexicoMicronesia, Fed. Sts.Middle East & North AfricaMiddle East & North Africa (excluding high income)Middle East & North Africa (IDA & IBRD countries)Middle incomeMoldovaMongoliaMontenegroMoroccoMozambiqueMyanmarNamibiaNepalNetherlandsNew ZealandNicaraguaNigerNigeriaNorth AmericaNorwayOECD membersOmanOther small statesPacific island small statesPakistanPalauPanamaParaguayPeruPhilippinesPolandPortugalPost-demographic dividendPre-demographic dividendPuerto RicoQatarRomaniaRussian FederationRwandaSamoaSao Tome and PrincipeSaudi ArabiaSenegalSerbiaSeychellesSierra LeoneSingaporeSlovak RepublicSloveniaSmall statesSouth AfricaSouth AsiaSouth Asia (IDA & IBRD)SpainSri LankaSt. Kitts and NevisSt. LuciaSt. Vincent and the GrenadinesSub-Saharan Africa Sub-Saharan Africa (excluding high income)Sub-Saharan Africa (IDA & IBRD countries)SudanSurinameSwazilandSwedenSwitzerlandTajikistanTanzaniaThailandTimor-LesteTogoTongaTrinidad and TobagoTunisiaTurkeyTuvaluUgandaUkraineUnited Arab EmiratesUnited KingdomUnited StatesUpper middle incomeUruguayUzbekistanVanuatuVenezuela, RBVietnamWest Bank and GazaWorldYemen, Rep.ZambiaZimbabwe Timeline:
This timeline shows a graph from 1971 to 2016 of Malaysia. No data until 1970. Number of actual observations by date: 46.
Source name:
World Development Indicators
Source organization:
World Bank national accounts data, and OECD National Accounts data files.
Categories, topics:
Economy & Growth
Last updated:
apr 23, 2017
Indicators value changes by year
Minimum:
2.118 bln
jan 1, 1971
Maximum:
75.815 bln
jan 1, 2016
At the date of observation
Value
Absolute change
Change from previous value
jan 1, 1971
2.118 bln
+2.118 bln
0.0%
jan 1, 1972
2.385 bln
+266.718 mln
12.59%
jan 1, 1973
2.628 bln
+242.669 mln
10.17%
jan 1, 1974
3.22 bln
+591.734 mln
22.52%
jan 1, 1975
3.553 bln
+333.762 mln
10.37%
jan 1, 1976
3.658 bln
+104.938 mln
2.95%
jan 1, 1977
4.335 bln
+676.996 mln
18.51%
jan 1, 1978
4.794 bln
+459.104 mln
10.59%
jan 1, 1979
5.239 bln
+444.529 mln
9.27%
jan 1, 1980
5.833 bln
+593.92 mln
11.34%
jan 1, 1981
6.371 bln
+537.808 mln
9.22%
jan 1, 1982
6.672 bln
+300.968 mln
4.72%
jan 1, 1983
7.045 bln
+373.842 mln
5.6%
jan 1, 1984
7.6 bln
+554.568 mln
7.87%
jan 1, 1985
8.534 bln
+934.241 mln
12.29%
jan 1, 1986
8.208 bln
-326.474 mln
-3.83%
jan 1, 1987
8.826 bln
+617.969 mln
7.53%
jan 1, 1988
10.008 bln
+1.183 bln
13.4%
jan 1, 1989
11.709 bln
+1.7 bln
16.99%
jan 1, 1990
14.088 bln
+2.38 bln
20.32%
jan 1, 1991
16.242 bln
+2.154 bln
15.29%
jan 1, 1992
18.516 bln
+2.274 bln
14.0%
jan 1, 1993
19.813 bln
+1.296 bln
7.0%
jan 1, 1994
22.701 bln
+2.889 bln
14.58%
jan 1, 1995
25.284 bln
+2.582 bln
11.37%
jan 1, 1996
28.156 bln
+2.872 bln
11.36%
jan 1, 1997
33.275 bln
+5.119 bln
18.18%
jan 1, 1998
36.641 bln
+3.366 bln
10.12%
jan 1, 1999
31.724 bln
-4.916 bln
-13.42%
jan 1, 2000
35.427 bln
+3.703 bln
11.67%
jan 1, 2001
41.915 bln
+6.488 bln
18.31%
jan 1, 2002
40.125 bln
-1.79 bln
-4.27%
jan 1, 2003
41.778 bln
+1.653 bln
4.12%
jan 1, 2004
45.607 bln
+3.828 bln
9.16%
jan 1, 2005
49.966 bln
+4.359 bln
9.56%
jan 1, 2006
52.562 bln
+2.596 bln
5.2%
jan 1, 2007
56.467 bln
+3.905 bln
7.43%
jan 1, 2008
61.555 bln
+5.088 bln
9.01%
jan 1, 2009
61.12 bln
-435.202 mln
-0.71%
jan 1, 2010
56.038 bln
-5.083 bln
-8.32%
jan 1, 2011
59.76 bln
+3.723 bln
6.64%
jan 1, 2012
63.009 bln
+3.249 bln
5.44%
jan 1, 2013
65.791 bln
+2.782 bln
4.42%
jan 1, 2014
68.036 bln
+2.244 bln
3.41%
jan 1, 2015
72.269 bln
+4.233 bln
6.22%
jan 1, 2016
75.815 bln
+3.546 bln
4.91%
Ranking of countries by current statistics by years


Comments: