29
/
en
AIzaSyAYiBZKx7MnpbEhh9jyipgxe19OcubqV5w
April 1, 2024
194496
Mauritius
MUS
true
2
1
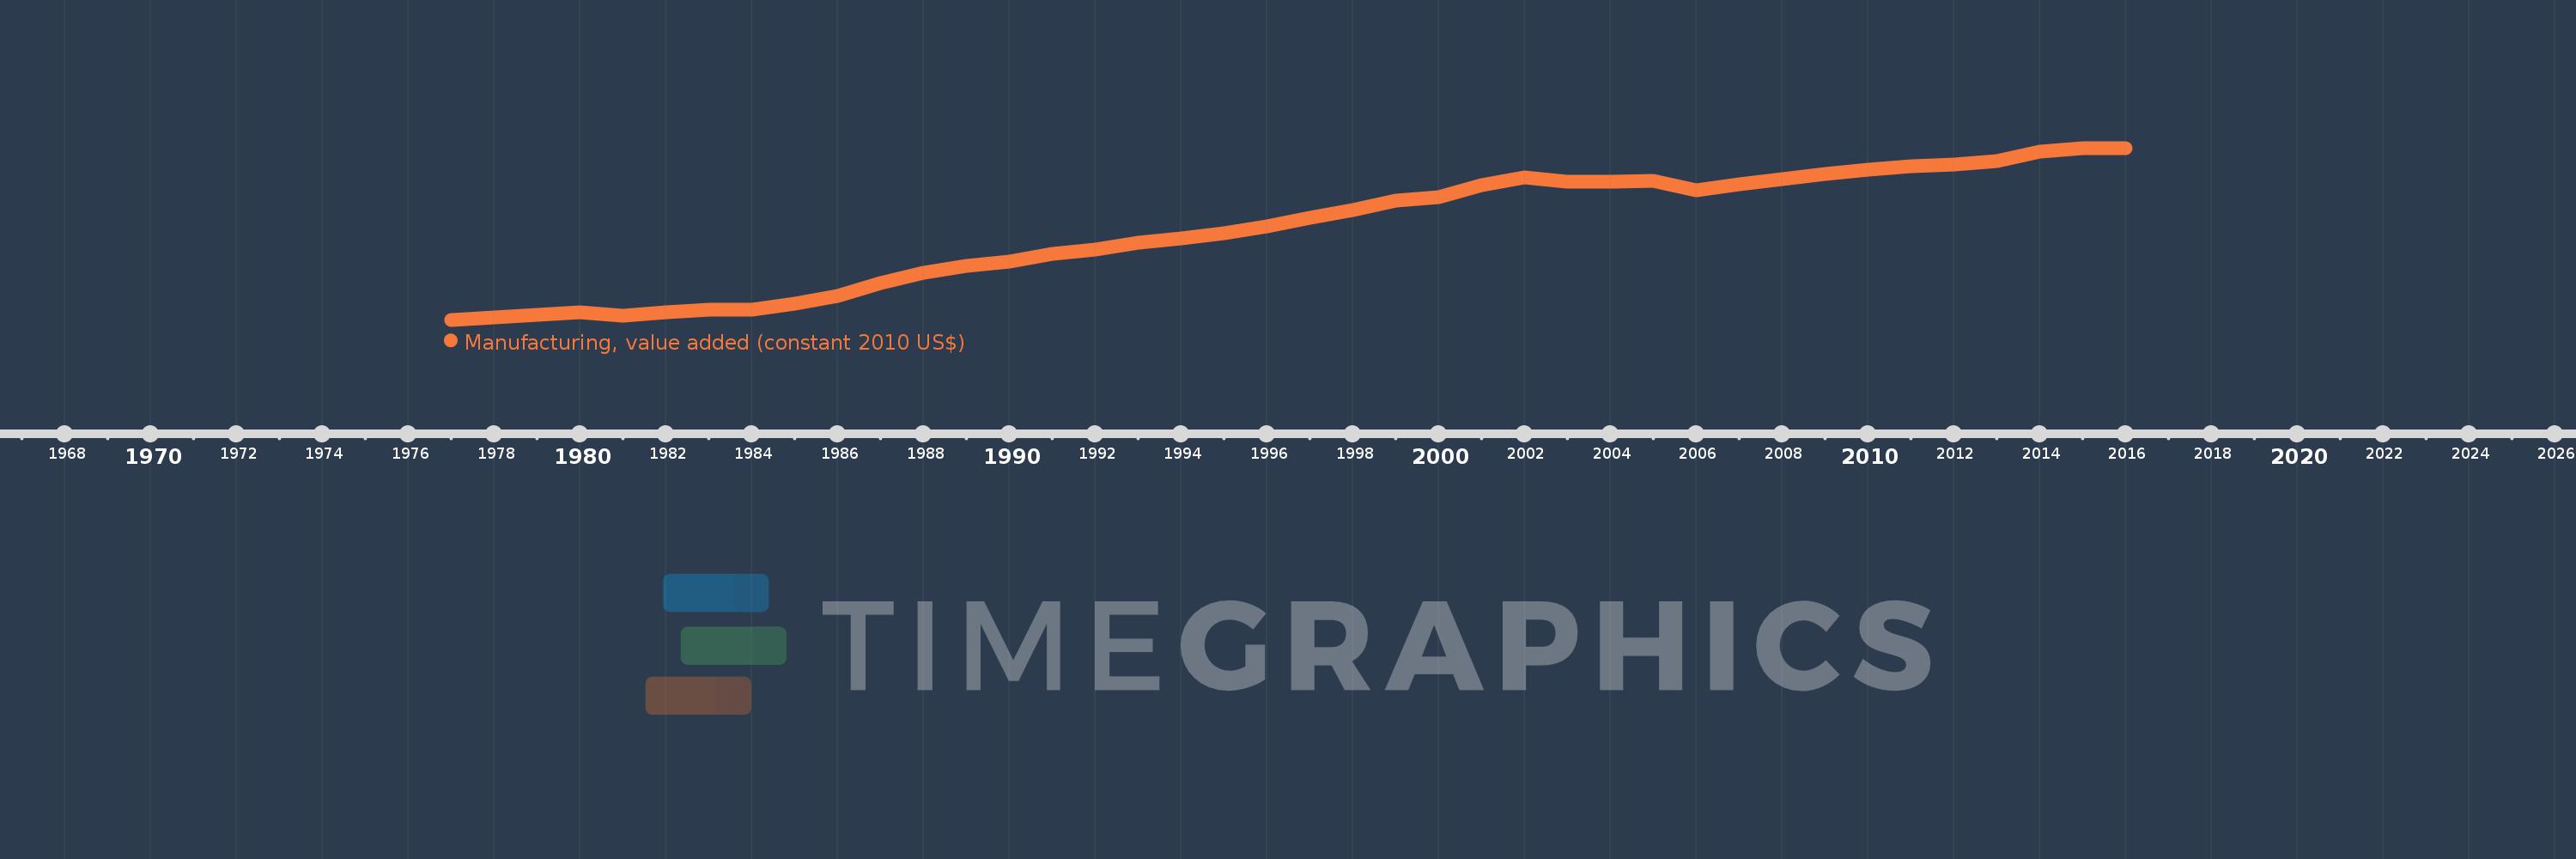
Manufacturing, value added (constant 2010 US$)
2016,2015,2014,2013,2012,2011,2010,2009,2008,2007,2006,2005,2004,2003,2002,2001,2000,1999,1998,1997,1996,1995,1994,1993,1992,1991,1990,1989,1988,1987,1986,1985,1984,1983,1982,1981,1980,1979,1978,1977
This statistics in other country:
AfghanistanAlbaniaAndorraAntigua and BarbudaArab WorldArgentinaArmeniaArubaAustraliaAustriaAzerbaijanBahamas, TheBahrainBangladeshBarbadosBelarusBelgiumBelizeBeninBermudaBhutanBoliviaBosnia and HerzegovinaBotswanaBrazilBrunei DarussalamBurkina FasoBurundiCambodiaCameroonCanadaCaribbean small statesCentral African RepublicCentral Europe and the BalticsChadChileChinaColombiaComorosCongo, Dem. Rep.Congo, Rep.Costa RicaCote d'IvoireCroatiaCubaCyprusCzech RepublicDenmarkDominicaDominican RepublicEarly-demographic dividendEast Asia & PacificEast Asia & Pacific (excluding high income)East Asia & Pacific (IDA & IBRD countries)EcuadorEgypt, Arab Rep.El SalvadorEquatorial GuineaEstoniaEthiopiaEuro areaEurope & Central AsiaEurope & Central Asia (excluding high income)Europe & Central Asia (IDA & IBRD countries)European UnionFaroe IslandsFijiFinlandFragile and conflict affected situationsFranceGabonGambia, TheGeorgiaGermanyGhanaGreeceGrenadaGuatemalaGuineaGuyanaHeavily indebted poor countries (HIPC)High incomeHondurasHong Kong SAR, ChinaHungaryIBRD onlyIcelandIDA & IBRD totalIDA blendIDA onlyIDA totalIndiaIndonesiaIran, Islamic Rep.IraqIrelandItalyJamaicaJapanJordanKazakhstanKenyaKiribatiKorea, Rep.KosovoKuwaitKyrgyz RepublicLao PDRLate-demographic dividendLatin America & Caribbean Latin America & Caribbean (excluding high income)Latin America & the Caribbean (IDA & IBRD countries)LatviaLeast developed countries: UN classificationLebanonLesothoLiberiaLithuaniaLow & middle incomeLow incomeLower middle incomeLuxembourgMacao SAR, ChinaMacedonia, FYRMalawiMalaysiaMaldivesMaltaMarshall IslandsMauritaniaMauritiusMexicoMicronesia, Fed. Sts.Middle East & North AfricaMiddle East & North Africa (excluding high income)Middle East & North Africa (IDA & IBRD countries)Middle incomeMoldovaMongoliaMontenegroMoroccoMozambiqueMyanmarNamibiaNepalNetherlandsNew ZealandNicaraguaNigerNigeriaNorth AmericaNorwayOECD membersOmanOther small statesPacific island small statesPakistanPalauPanamaParaguayPeruPhilippinesPolandPortugalPost-demographic dividendPre-demographic dividendPuerto RicoQatarRomaniaRussian FederationRwandaSamoaSao Tome and PrincipeSaudi ArabiaSenegalSerbiaSeychellesSierra LeoneSingaporeSlovak RepublicSloveniaSmall statesSouth AfricaSouth AsiaSouth Asia (IDA & IBRD)SpainSri LankaSt. Kitts and NevisSt. LuciaSt. Vincent and the GrenadinesSub-Saharan Africa Sub-Saharan Africa (excluding high income)Sub-Saharan Africa (IDA & IBRD countries)SudanSurinameSwazilandSwedenSwitzerlandTajikistanTanzaniaThailandTimor-LesteTogoTongaTrinidad and TobagoTunisiaTurkeyTuvaluUgandaUkraineUnited Arab EmiratesUnited KingdomUnited StatesUpper middle incomeUruguayUzbekistanVanuatuVenezuela, RBVietnamWest Bank and GazaWorldYemen, Rep.ZambiaZimbabwe Timeline:
This timeline shows a graph from 1977 to 2016 of Mauritius. No data until 1976. Number of actual observations by date: 40.
Source name:
World Development Indicators
Source organization:
World Bank national accounts data, and OECD National Accounts data files.
Categories, topics:
Economy & Growth
Last updated:
apr 23, 2017
Indicators value changes by year
Minimum:
272.652 mln
jan 1, 1977
Maximum:
1.553 bln
jan 1, 2016
At the date of observation
Value
Absolute change
Change from previous value
jan 1, 1977
272.652 mln
+272.652 mln
0.0%
jan 1, 1978
287.775 mln
+15.123 mln
5.55%
jan 1, 1979
309.812 mln
+22.037 mln
7.66%
jan 1, 1980
325.799 mln
+15.987 mln
5.16%
jan 1, 1981
302.898 mln
-22.901 mln
-7.03%
jan 1, 1982
329.256 mln
+26.358 mln
8.7%
jan 1, 1983
346.54 mln
+17.284 mln
5.25%
jan 1, 1984
350.094 mln
+3.554 mln
1.03%
jan 1, 1985
392.745 mln
+42.651 mln
12.18%
jan 1, 1986
452.723 mln
+59.978 mln
15.27%
jan 1, 1987
544.245 mln
+91.522 mln
20.22%
jan 1, 1988
623.705 mln
+79.46 mln
14.6%
jan 1, 1989
673.466 mln
+49.761 mln
7.98%
jan 1, 1990
706.682 mln
+33.216 mln
4.93%
jan 1, 1991
761.206 mln
+54.524 mln
7.72%
jan 1, 1992
794.045 mln
+32.839 mln
4.31%
jan 1, 1993
846.693 mln
+52.648 mln
6.63%
jan 1, 1994
879.793 mln
+33.101 mln
3.91%
jan 1, 1995
915.075 mln
+35.282 mln
4.01%
jan 1, 1996
968.804 mln
+53.729 mln
5.87%
jan 1, 1997
1.031 bln
+62.673 mln
6.47%
jan 1, 1998
1.093 bln
+61.358 mln
5.95%
jan 1, 1999
1.16 bln
+66.952 mln
6.13%
jan 1, 2000
1.183 bln
+23.662 mln
2.04%
jan 1, 2001
1.277 bln
+93.166 mln
7.87%
jan 1, 2002
1.333 bln
+56.801 mln
4.45%
jan 1, 2003
1.301 bln
-32.195 mln
-2.41%
jan 1, 2004
1.301 bln
-151.843K
-0.01%
jan 1, 2005
1.308 bln
+6.662 mln
0.51%
jan 1, 2006
1.236 bln
-72.049 mln
-5.51%
jan 1, 2007
1.285 bln
+48.819 mln
3.95%
jan 1, 2008
1.318 bln
+33.728 mln
2.63%
jan 1, 2009
1.357 bln
+38.801 mln
2.94%
jan 1, 2010
1.39 bln
+33.202 mln
2.45%
jan 1, 2011
1.417 bln
+26.718 mln
1.92%
jan 1, 2012
1.428 bln
+10.62 mln
0.75%
jan 1, 2013
1.457 bln
+29.453 mln
2.06%
jan 1, 2014
1.526 bln
+68.59 mln
4.71%
jan 1, 2015
1.553 bln
+27.352 mln
1.79%
jan 1, 2016
1.553 bln
+106.177K
0.01%
Ranking of countries by current statistics by years


Comments: