29
/
en
AIzaSyAYiBZKx7MnpbEhh9jyipgxe19OcubqV5w
April 1, 2024
42602
Latin America & Caribbean (excluding high income)
LAC
false
2
1
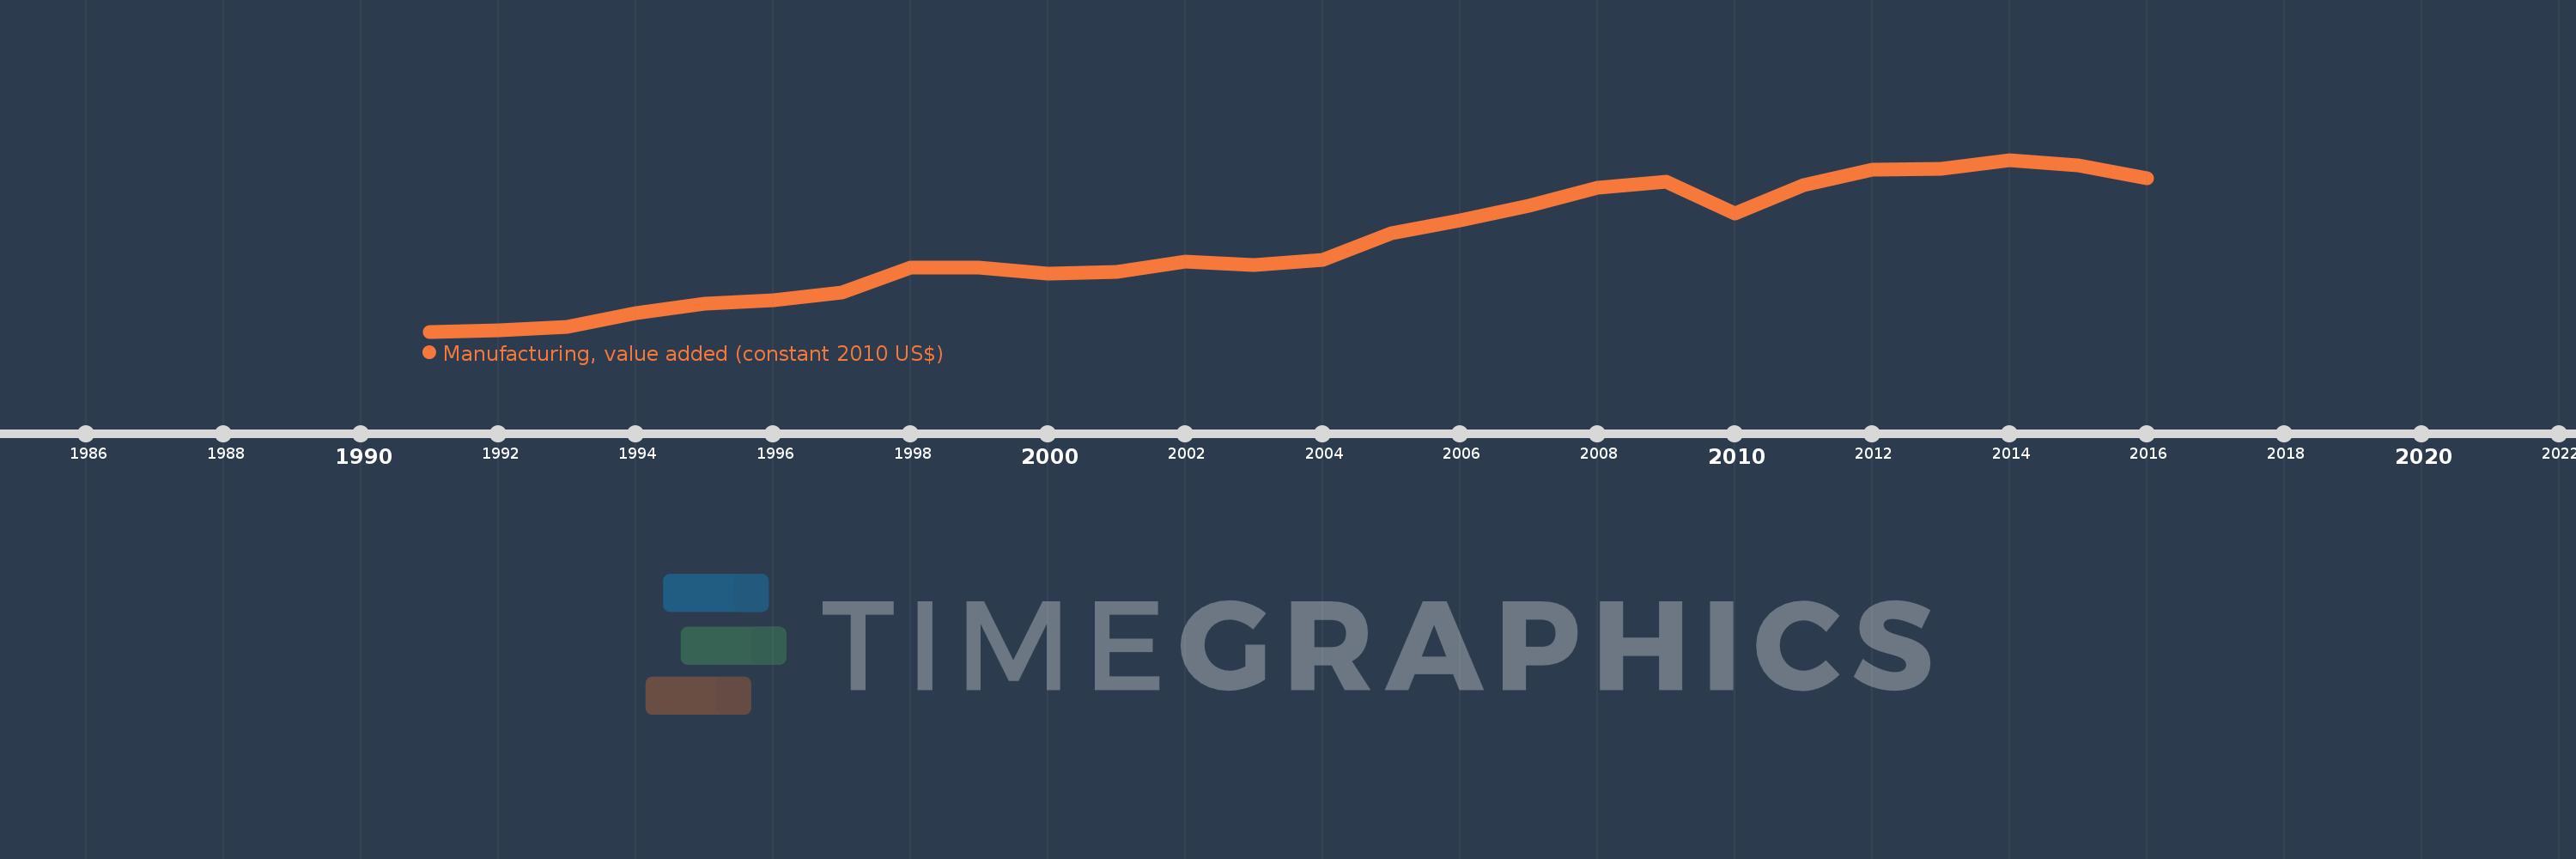
Manufacturing, value added (constant 2010 US$)
2016,2015,2014,2013,2012,2011,2010,2009,2008,2007,2006,2005,2004,2003,2002,2001,2000,1999,1998,1997,1996,1995,1994,1993,1992,1991
This statistics in other country:
AfghanistanAlbaniaAndorraAntigua and BarbudaArab WorldArgentinaArmeniaArubaAustraliaAustriaAzerbaijanBahamas, TheBahrainBangladeshBarbadosBelarusBelgiumBelizeBeninBermudaBhutanBoliviaBosnia and HerzegovinaBotswanaBrazilBrunei DarussalamBurkina FasoBurundiCambodiaCameroonCanadaCaribbean small statesCentral African RepublicCentral Europe and the BalticsChadChileChinaColombiaComorosCongo, Dem. Rep.Congo, Rep.Costa RicaCote d'IvoireCroatiaCubaCyprusCzech RepublicDenmarkDominicaDominican RepublicEarly-demographic dividendEast Asia & PacificEast Asia & Pacific (excluding high income)East Asia & Pacific (IDA & IBRD countries)EcuadorEgypt, Arab Rep.El SalvadorEquatorial GuineaEstoniaEthiopiaEuro areaEurope & Central AsiaEurope & Central Asia (excluding high income)Europe & Central Asia (IDA & IBRD countries)European UnionFaroe IslandsFijiFinlandFragile and conflict affected situationsFranceGabonGambia, TheGeorgiaGermanyGhanaGreeceGrenadaGuatemalaGuineaGuyanaHeavily indebted poor countries (HIPC)High incomeHondurasHong Kong SAR, ChinaHungaryIBRD onlyIcelandIDA & IBRD totalIDA blendIDA onlyIDA totalIndiaIndonesiaIran, Islamic Rep.IraqIrelandItalyJamaicaJapanJordanKazakhstanKenyaKiribatiKorea, Rep.KosovoKuwaitKyrgyz RepublicLao PDRLate-demographic dividendLatin America & Caribbean Latin America & Caribbean (excluding high income)Latin America & the Caribbean (IDA & IBRD countries)LatviaLeast developed countries: UN classificationLebanonLesothoLiberiaLithuaniaLow & middle incomeLow incomeLower middle incomeLuxembourgMacao SAR, ChinaMacedonia, FYRMalawiMalaysiaMaldivesMaltaMarshall IslandsMauritaniaMauritiusMexicoMicronesia, Fed. Sts.Middle East & North AfricaMiddle East & North Africa (excluding high income)Middle East & North Africa (IDA & IBRD countries)Middle incomeMoldovaMongoliaMontenegroMoroccoMozambiqueMyanmarNamibiaNepalNetherlandsNew ZealandNicaraguaNigerNigeriaNorth AmericaNorwayOECD membersOmanOther small statesPacific island small statesPakistanPalauPanamaParaguayPeruPhilippinesPolandPortugalPost-demographic dividendPre-demographic dividendPuerto RicoQatarRomaniaRussian FederationRwandaSamoaSao Tome and PrincipeSaudi ArabiaSenegalSerbiaSeychellesSierra LeoneSingaporeSlovak RepublicSloveniaSmall statesSouth AfricaSouth AsiaSouth Asia (IDA & IBRD)SpainSri LankaSt. Kitts and NevisSt. LuciaSt. Vincent and the GrenadinesSub-Saharan Africa Sub-Saharan Africa (excluding high income)Sub-Saharan Africa (IDA & IBRD countries)SudanSurinameSwazilandSwedenSwitzerlandTajikistanTanzaniaThailandTimor-LesteTogoTongaTrinidad and TobagoTunisiaTurkeyTuvaluUgandaUkraineUnited Arab EmiratesUnited KingdomUnited StatesUpper middle incomeUruguayUzbekistanVanuatuVenezuela, RBVietnamWest Bank and GazaWorldYemen, Rep.ZambiaZimbabwe Timeline:
This timeline shows a graph from 1991 to 2016 of Latin America & Caribbean (excluding high income). No data until 1990. Number of actual observations by date: 26.
Source name:
World Development Indicators
Source organization:
World Bank national accounts data, and OECD National Accounts data files.
Categories, topics:
Economy & Growth
Last updated:
apr 23, 2017
Indicators value changes by year
Minimum:
436.613 bln
jan 1, 1991
Maximum:
725.295 bln
jan 1, 2014
At the date of observation
Value
Absolute change
Change from previous value
jan 1, 1991
436.613 bln
+436.613 bln
0.0%
jan 1, 1992
439.434 bln
+2.821 bln
0.65%
jan 1, 1993
445.08 bln
+5.646 bln
1.28%
jan 1, 1994
468.237 bln
+23.158 bln
5.2%
jan 1, 1995
483.584 bln
+15.347 bln
3.28%
jan 1, 1996
489.213 bln
+5.628 bln
1.16%
jan 1, 1997
502.586 bln
+13.373 bln
2.73%
jan 1, 1998
543.502 bln
+40.916 bln
8.14%
jan 1, 1999
543.665 bln
+163.758 mln
0.03%
jan 1, 2000
534.647 bln
-9.019 bln
-1.66%
jan 1, 2001
536.849 bln
+2.203 bln
0.41%
jan 1, 2002
553.998 bln
+17.149 bln
3.19%
jan 1, 2003
548.304 bln
-5.694 bln
-1.03%
jan 1, 2004
556.97 bln
+8.665 bln
1.58%
jan 1, 2005
602.594 bln
+45.624 bln
8.19%
jan 1, 2006
623.111 bln
+20.517 bln
3.4%
jan 1, 2007
647.677 bln
+24.565 bln
3.94%
jan 1, 2008
677.757 bln
+30.08 bln
4.64%
jan 1, 2009
688.363 bln
+10.606 bln
1.56%
jan 1, 2010
634.928 bln
-53.436 bln
-7.76%
jan 1, 2011
682.115 bln
+47.188 bln
7.43%
jan 1, 2012
709.077 bln
+26.961 bln
3.95%
jan 1, 2013
710.259 bln
+1.182 bln
0.17%
jan 1, 2014
725.295 bln
+15.036 bln
2.12%
jan 1, 2015
715.929 bln
-9.366 bln
-1.29%
jan 1, 2016
694.08 bln
-21.849 bln
-3.05%
Ranking of countries by current statistics by years


Comments: