29
/
en
AIzaSyAYiBZKx7MnpbEhh9jyipgxe19OcubqV5w
April 1, 2024
268254
Tunisia
TUN
true
2
1
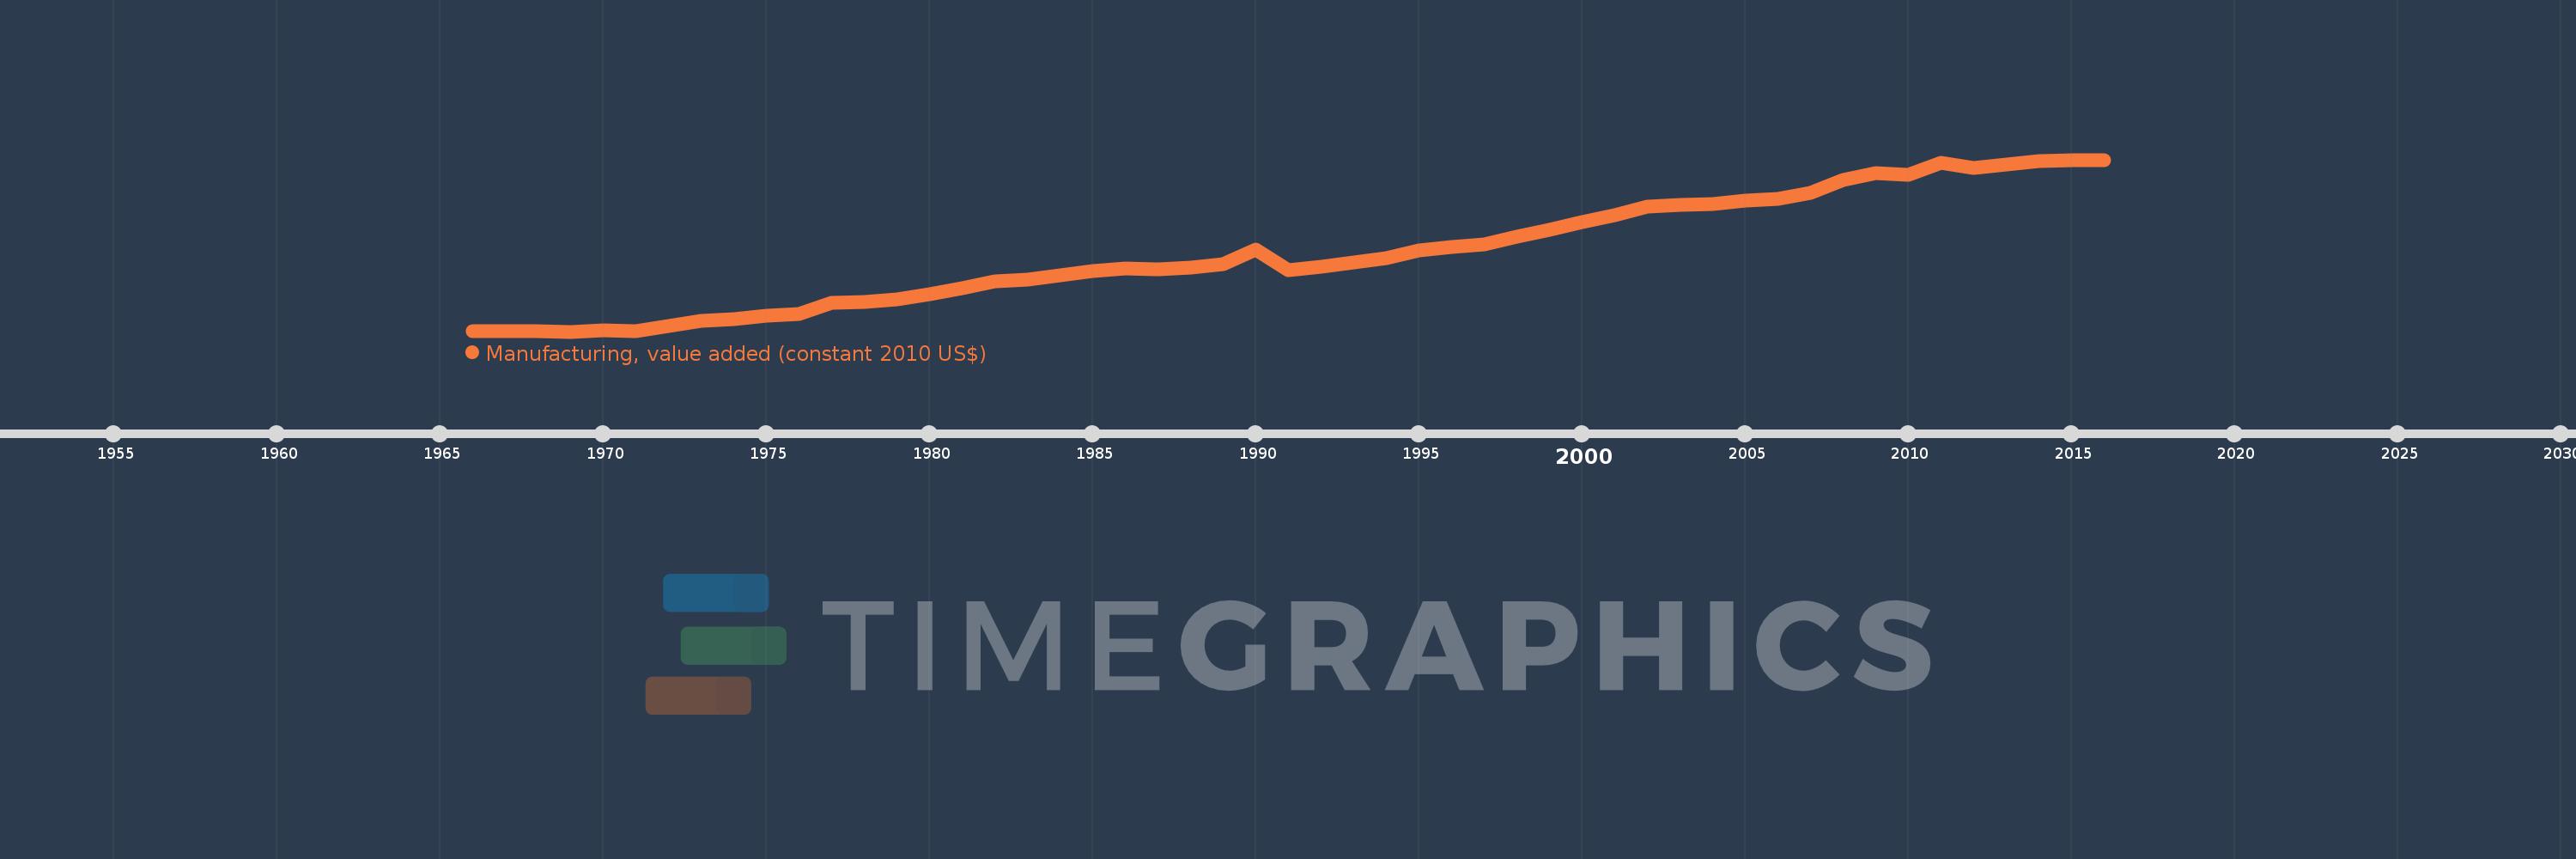
Manufacturing, value added (constant 2010 US$)
2016,2015,2014,2013,2012,2011,2010,2009,2008,2007,2006,2005,2004,2003,2002,2001,2000,1999,1998,1997,1996,1995,1994,1993,1992,1991,1990,1989,1988,1987,1986,1985,1984,1983,1982,1981,1980,1979,1978,1977,1976,1975,1974,1973,1972,1971,1970,1969,1968,1967,1966
This statistics in other country:
AfghanistanAlbaniaAndorraAntigua and BarbudaArab WorldArgentinaArmeniaArubaAustraliaAustriaAzerbaijanBahamas, TheBahrainBangladeshBarbadosBelarusBelgiumBelizeBeninBermudaBhutanBoliviaBosnia and HerzegovinaBotswanaBrazilBrunei DarussalamBurkina FasoBurundiCambodiaCameroonCanadaCaribbean small statesCentral African RepublicCentral Europe and the BalticsChadChileChinaColombiaComorosCongo, Dem. Rep.Congo, Rep.Costa RicaCote d'IvoireCroatiaCubaCyprusCzech RepublicDenmarkDominicaDominican RepublicEarly-demographic dividendEast Asia & PacificEast Asia & Pacific (excluding high income)East Asia & Pacific (IDA & IBRD countries)EcuadorEgypt, Arab Rep.El SalvadorEquatorial GuineaEstoniaEthiopiaEuro areaEurope & Central AsiaEurope & Central Asia (excluding high income)Europe & Central Asia (IDA & IBRD countries)European UnionFaroe IslandsFijiFinlandFragile and conflict affected situationsFranceGabonGambia, TheGeorgiaGermanyGhanaGreeceGrenadaGuatemalaGuineaGuyanaHeavily indebted poor countries (HIPC)High incomeHondurasHong Kong SAR, ChinaHungaryIBRD onlyIcelandIDA & IBRD totalIDA blendIDA onlyIDA totalIndiaIndonesiaIran, Islamic Rep.IraqIrelandItalyJamaicaJapanJordanKazakhstanKenyaKiribatiKorea, Rep.KosovoKuwaitKyrgyz RepublicLao PDRLate-demographic dividendLatin America & Caribbean Latin America & Caribbean (excluding high income)Latin America & the Caribbean (IDA & IBRD countries)LatviaLeast developed countries: UN classificationLebanonLesothoLiberiaLithuaniaLow & middle incomeLow incomeLower middle incomeLuxembourgMacao SAR, ChinaMacedonia, FYRMalawiMalaysiaMaldivesMaltaMarshall IslandsMauritaniaMauritiusMexicoMicronesia, Fed. Sts.Middle East & North AfricaMiddle East & North Africa (excluding high income)Middle East & North Africa (IDA & IBRD countries)Middle incomeMoldovaMongoliaMontenegroMoroccoMozambiqueMyanmarNamibiaNepalNetherlandsNew ZealandNicaraguaNigerNigeriaNorth AmericaNorwayOECD membersOmanOther small statesPacific island small statesPakistanPalauPanamaParaguayPeruPhilippinesPolandPortugalPost-demographic dividendPre-demographic dividendPuerto RicoQatarRomaniaRussian FederationRwandaSamoaSao Tome and PrincipeSaudi ArabiaSenegalSerbiaSeychellesSierra LeoneSingaporeSlovak RepublicSloveniaSmall statesSouth AfricaSouth AsiaSouth Asia (IDA & IBRD)SpainSri LankaSt. Kitts and NevisSt. LuciaSt. Vincent and the GrenadinesSub-Saharan Africa Sub-Saharan Africa (excluding high income)Sub-Saharan Africa (IDA & IBRD countries)SudanSurinameSwazilandSwedenSwitzerlandTajikistanTanzaniaThailandTimor-LesteTogoTongaTrinidad and TobagoTunisiaTurkeyTuvaluUgandaUkraineUnited Arab EmiratesUnited KingdomUnited StatesUpper middle incomeUruguayUzbekistanVanuatuVenezuela, RBVietnamWest Bank and GazaWorldYemen, Rep.ZambiaZimbabwe Timeline:
This timeline shows a graph from 1966 to 2016 of Tunisia. No data until 1965. Number of actual observations by date: 51.
Source name:
World Development Indicators
Source organization:
World Bank national accounts data, and OECD National Accounts data files.
Categories, topics:
Economy & Growth
Last updated:
apr 23, 2017
Indicators value changes by year
Minimum:
484.376 mln
jan 1, 1969
Maximum:
7.406 bln
jan 1, 2015
At the date of observation
Value
Absolute change
Change from previous value
jan 1, 1966
513.643 mln
+513.643 mln
0.0%
jan 1, 1967
512.343 mln
-1.301 mln
-0.25%
jan 1, 1968
503.4 mln
-8.943 mln
-1.75%
jan 1, 1969
484.376 mln
-19.024 mln
-3.78%
jan 1, 1970
522.098 mln
+37.723 mln
7.79%
jan 1, 1971
492.181 mln
-29.918 mln
-5.73%
jan 1, 1972
702.256 mln
+210.075 mln
42.68%
jan 1, 1973
932.981 mln
+230.725 mln
32.85%
jan 1, 1974
988.751 mln
+55.771 mln
5.98%
jan 1, 1975
1.138 bln
+149.264 mln
15.1%
jan 1, 1976
1.205 bln
+66.827 mln
5.87%
jan 1, 1977
1.631 bln
+426.654 mln
35.41%
jan 1, 1978
1.685 bln
+53.169 mln
3.26%
jan 1, 1979
1.784 bln
+98.859 mln
5.87%
jan 1, 1980
1.99 bln
+206.498 mln
11.58%
jan 1, 1981
2.23 bln
+239.83 mln
12.05%
jan 1, 1982
2.519 bln
+289.585 mln
12.99%
jan 1, 1983
2.59 bln
+70.892 mln
2.81%
jan 1, 1984
2.739 bln
+148.613 mln
5.74%
jan 1, 1985
2.918 bln
+178.694 mln
6.52%
jan 1, 1986
3.031 bln
+113.33 mln
3.88%
jan 1, 1987
3.003 bln
-27.642 mln
-0.91%
jan 1, 1988
3.072 bln
+68.779 mln
2.29%
jan 1, 1989
3.192 bln
+119.996 mln
3.91%
jan 1, 1990
3.8 bln
+608.275 mln
19.06%
jan 1, 1991
2.97 bln
-830.544 mln
-21.85%
jan 1, 1992
3.085 bln
+115.444 mln
3.89%
jan 1, 1993
3.285 bln
+199.344 mln
6.46%
jan 1, 1994
3.446 bln
+161.621 mln
4.92%
jan 1, 1995
3.744 bln
+297.877 mln
8.64%
jan 1, 1996
3.909 bln
+164.385 mln
4.39%
jan 1, 1997
4.014 bln
+105.525 mln
2.7%
jan 1, 1998
4.315 bln
+300.479 mln
7.49%
jan 1, 1999
4.573 bln
+258.245 mln
5.99%
jan 1, 2000
4.892 bln
+319.549 mln
6.99%
jan 1, 2001
5.173 bln
+280.796 mln
5.74%
jan 1, 2002
5.528 bln
+354.633 mln
6.86%
jan 1, 2003
5.573 bln
+45.169 mln
0.82%
jan 1, 2004
5.614 bln
+41.217 mln
0.74%
jan 1, 2005
5.749 bln
+134.668 mln
2.4%
jan 1, 2006
5.824 bln
+75.072 mln
1.31%
jan 1, 2007
6.061 bln
+236.782 mln
4.07%
jan 1, 2008
6.587 bln
+526.299 mln
8.68%
jan 1, 2009
6.87 bln
+283.018 mln
4.3%
jan 1, 2010
6.803 bln
-66.917 mln
-0.97%
jan 1, 2011
7.281 bln
+477.878 mln
7.02%
jan 1, 2012
7.083 bln
-197.535 mln
-2.71%
jan 1, 2013
7.228 bln
+145.066 mln
2.05%
jan 1, 2014
7.34 bln
+111.5 mln
1.54%
jan 1, 2015
7.406 bln
+65.776 mln
0.9%
jan 1, 2016
7.404 bln
-1.294 mln
-0.02%
Ranking of countries by current statistics by years


Comments: