29
/
en
AIzaSyAYiBZKx7MnpbEhh9jyipgxe19OcubqV5w
April 1, 2024
41650
Latin America & Caribbean
LCN
false
2
1
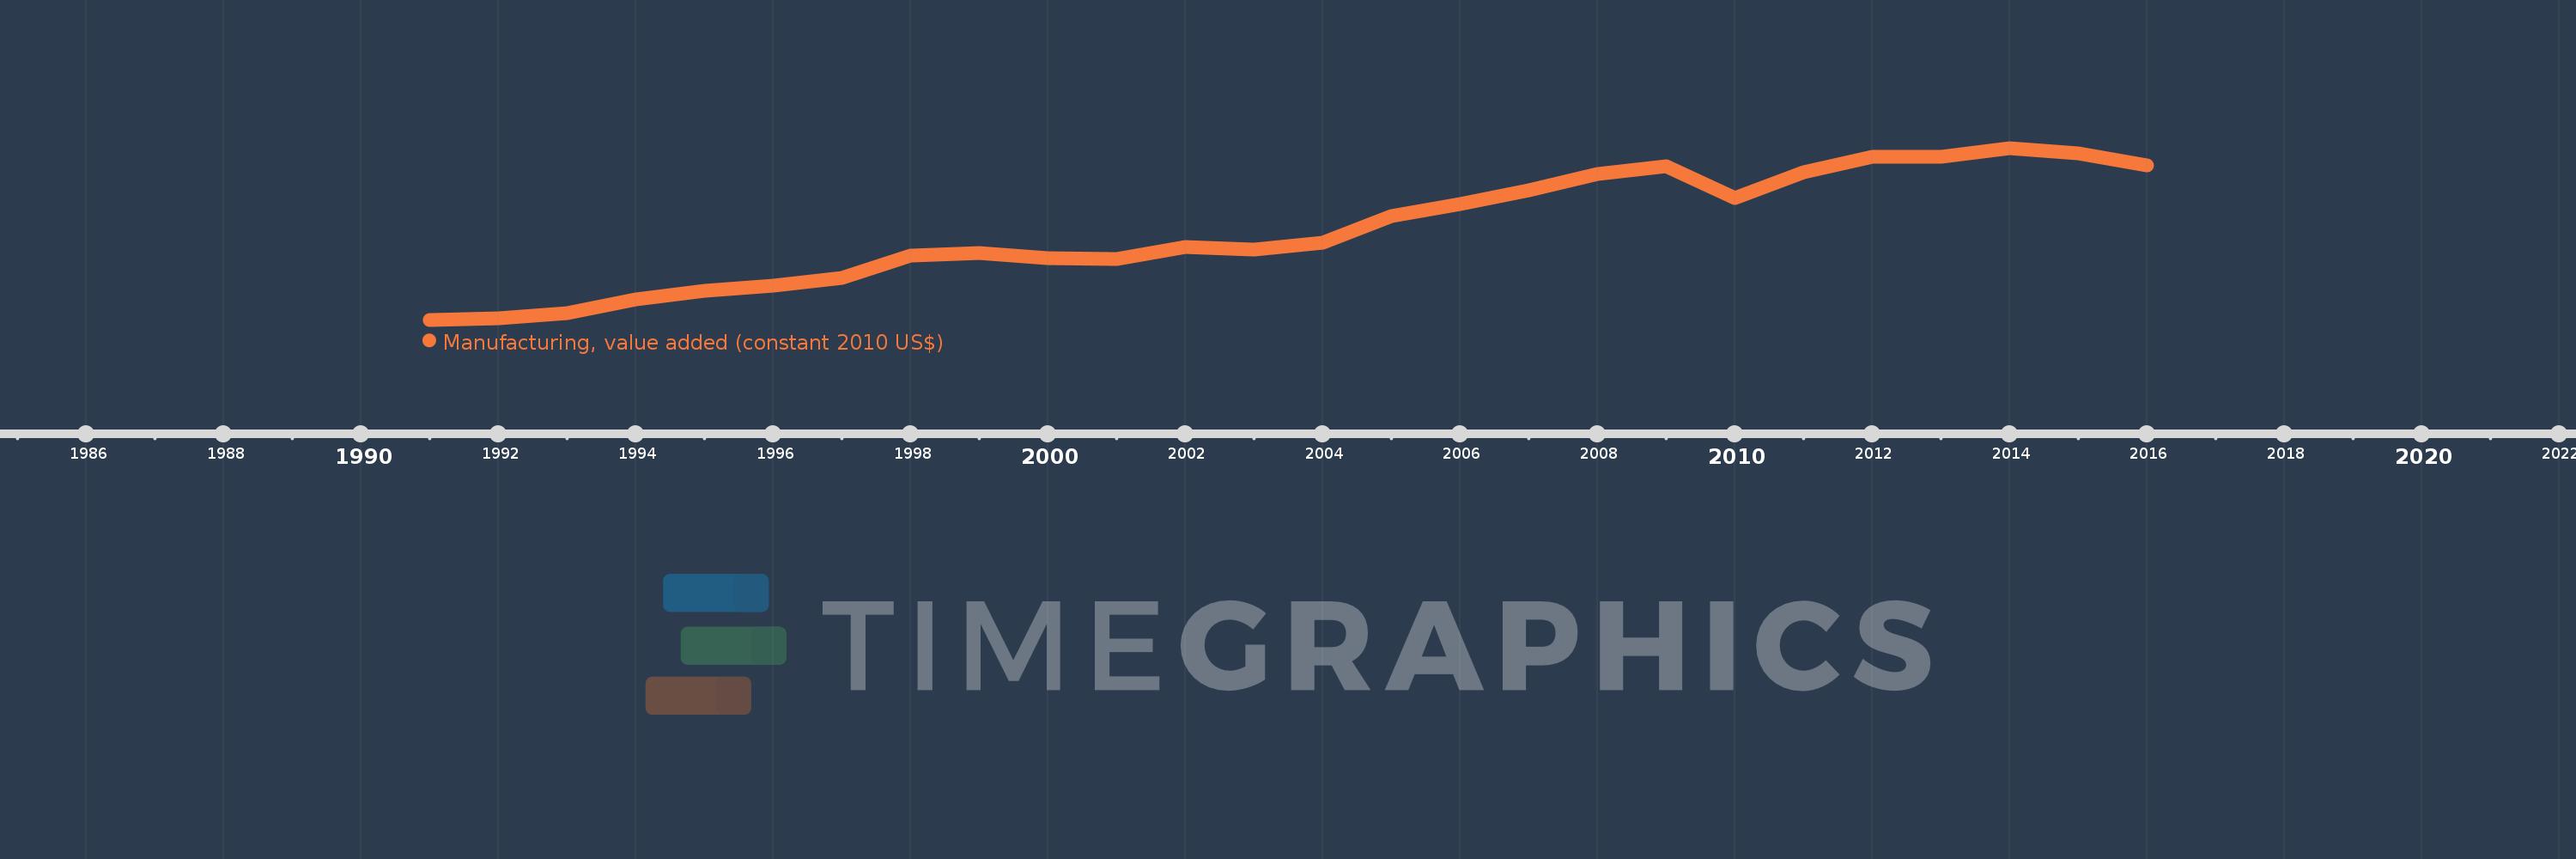
Manufacturing, value added (constant 2010 US$)
2016,2015,2014,2013,2012,2011,2010,2009,2008,2007,2006,2005,2004,2003,2002,2001,2000,1999,1998,1997,1996,1995,1994,1993,1992,1991
This statistics in other country:
AfghanistanAlbaniaAndorraAntigua and BarbudaArab WorldArgentinaArmeniaArubaAustraliaAustriaAzerbaijanBahamas, TheBahrainBangladeshBarbadosBelarusBelgiumBelizeBeninBermudaBhutanBoliviaBosnia and HerzegovinaBotswanaBrazilBrunei DarussalamBurkina FasoBurundiCambodiaCameroonCanadaCaribbean small statesCentral African RepublicCentral Europe and the BalticsChadChileChinaColombiaComorosCongo, Dem. Rep.Congo, Rep.Costa RicaCote d'IvoireCroatiaCubaCyprusCzech RepublicDenmarkDominicaDominican RepublicEarly-demographic dividendEast Asia & PacificEast Asia & Pacific (excluding high income)East Asia & Pacific (IDA & IBRD countries)EcuadorEgypt, Arab Rep.El SalvadorEquatorial GuineaEstoniaEthiopiaEuro areaEurope & Central AsiaEurope & Central Asia (excluding high income)Europe & Central Asia (IDA & IBRD countries)European UnionFaroe IslandsFijiFinlandFragile and conflict affected situationsFranceGabonGambia, TheGeorgiaGermanyGhanaGreeceGrenadaGuatemalaGuineaGuyanaHeavily indebted poor countries (HIPC)High incomeHondurasHong Kong SAR, ChinaHungaryIBRD onlyIcelandIDA & IBRD totalIDA blendIDA onlyIDA totalIndiaIndonesiaIran, Islamic Rep.IraqIrelandItalyJamaicaJapanJordanKazakhstanKenyaKiribatiKorea, Rep.KosovoKuwaitKyrgyz RepublicLao PDRLate-demographic dividendLatin America & Caribbean Latin America & Caribbean (excluding high income)Latin America & the Caribbean (IDA & IBRD countries)LatviaLeast developed countries: UN classificationLebanonLesothoLiberiaLithuaniaLow & middle incomeLow incomeLower middle incomeLuxembourgMacao SAR, ChinaMacedonia, FYRMalawiMalaysiaMaldivesMaltaMarshall IslandsMauritaniaMauritiusMexicoMicronesia, Fed. Sts.Middle East & North AfricaMiddle East & North Africa (excluding high income)Middle East & North Africa (IDA & IBRD countries)Middle incomeMoldovaMongoliaMontenegroMoroccoMozambiqueMyanmarNamibiaNepalNetherlandsNew ZealandNicaraguaNigerNigeriaNorth AmericaNorwayOECD membersOmanOther small statesPacific island small statesPakistanPalauPanamaParaguayPeruPhilippinesPolandPortugalPost-demographic dividendPre-demographic dividendPuerto RicoQatarRomaniaRussian FederationRwandaSamoaSao Tome and PrincipeSaudi ArabiaSenegalSerbiaSeychellesSierra LeoneSingaporeSlovak RepublicSloveniaSmall statesSouth AfricaSouth AsiaSouth Asia (IDA & IBRD)SpainSri LankaSt. Kitts and NevisSt. LuciaSt. Vincent and the GrenadinesSub-Saharan Africa Sub-Saharan Africa (excluding high income)Sub-Saharan Africa (IDA & IBRD countries)SudanSurinameSwazilandSwedenSwitzerlandTajikistanTanzaniaThailandTimor-LesteTogoTongaTrinidad and TobagoTunisiaTurkeyTuvaluUgandaUkraineUnited Arab EmiratesUnited KingdomUnited StatesUpper middle incomeUruguayUzbekistanVanuatuVenezuela, RBVietnamWest Bank and GazaWorldYemen, Rep.ZambiaZimbabwe Timeline:
This timeline shows a graph from 1991 to 2016 of Latin America & Caribbean . No data until 1990. Number of actual observations by date: 26.
Source name:
World Development Indicators
Source organization:
World Bank national accounts data, and OECD National Accounts data files.
Categories, topics:
Economy & Growth
Last updated:
apr 23, 2017
Indicators value changes by year
Minimum:
482.872 bln
jan 1, 1991
Maximum:
805.436 bln
jan 1, 2014
At the date of observation
Value
Absolute change
Change from previous value
jan 1, 1991
482.872 bln
+482.872 bln
0.0%
jan 1, 1992
485.894 bln
+3.022 bln
0.63%
jan 1, 1993
495.23 bln
+9.336 bln
1.92%
jan 1, 1994
520.624 bln
+25.393 bln
5.13%
jan 1, 1995
537.962 bln
+17.338 bln
3.33%
jan 1, 1996
546.984 bln
+9.021 bln
1.68%
jan 1, 1997
561.125 bln
+14.142 bln
2.59%
jan 1, 1998
603.257 bln
+42.132 bln
7.51%
jan 1, 1999
607.656 bln
+4.399 bln
0.73%
jan 1, 2000
598.863 bln
-8.792 bln
-1.45%
jan 1, 2001
596.564 bln
-2.3 bln
-0.38%
jan 1, 2002
619.561 bln
+22.998 bln
3.86%
jan 1, 2003
614.967 bln
-4.594 bln
-0.74%
jan 1, 2004
628.205 bln
+13.238 bln
2.15%
jan 1, 2005
677.742 bln
+49.537 bln
7.89%
jan 1, 2006
700.676 bln
+22.934 bln
3.38%
jan 1, 2007
725.891 bln
+25.215 bln
3.6%
jan 1, 2008
756.295 bln
+30.404 bln
4.19%
jan 1, 2009
771.093 bln
+14.798 bln
1.96%
jan 1, 2010
710.606 bln
-60.487 bln
-7.84%
jan 1, 2011
760.215 bln
+49.609 bln
6.98%
jan 1, 2012
788.376 bln
+28.161 bln
3.7%
jan 1, 2013
789.449 bln
+1.073 bln
0.14%
jan 1, 2014
805.436 bln
+15.987 bln
2.03%
jan 1, 2015
795.515 bln
-9.921 bln
-1.23%
jan 1, 2016
773.367 bln
-22.148 bln
-2.78%
Ranking of countries by current statistics by years


Comments: