29
/
en
AIzaSyAYiBZKx7MnpbEhh9jyipgxe19OcubqV5w
April 1, 2024
25071
Caribbean small states
CSS
false
2
1
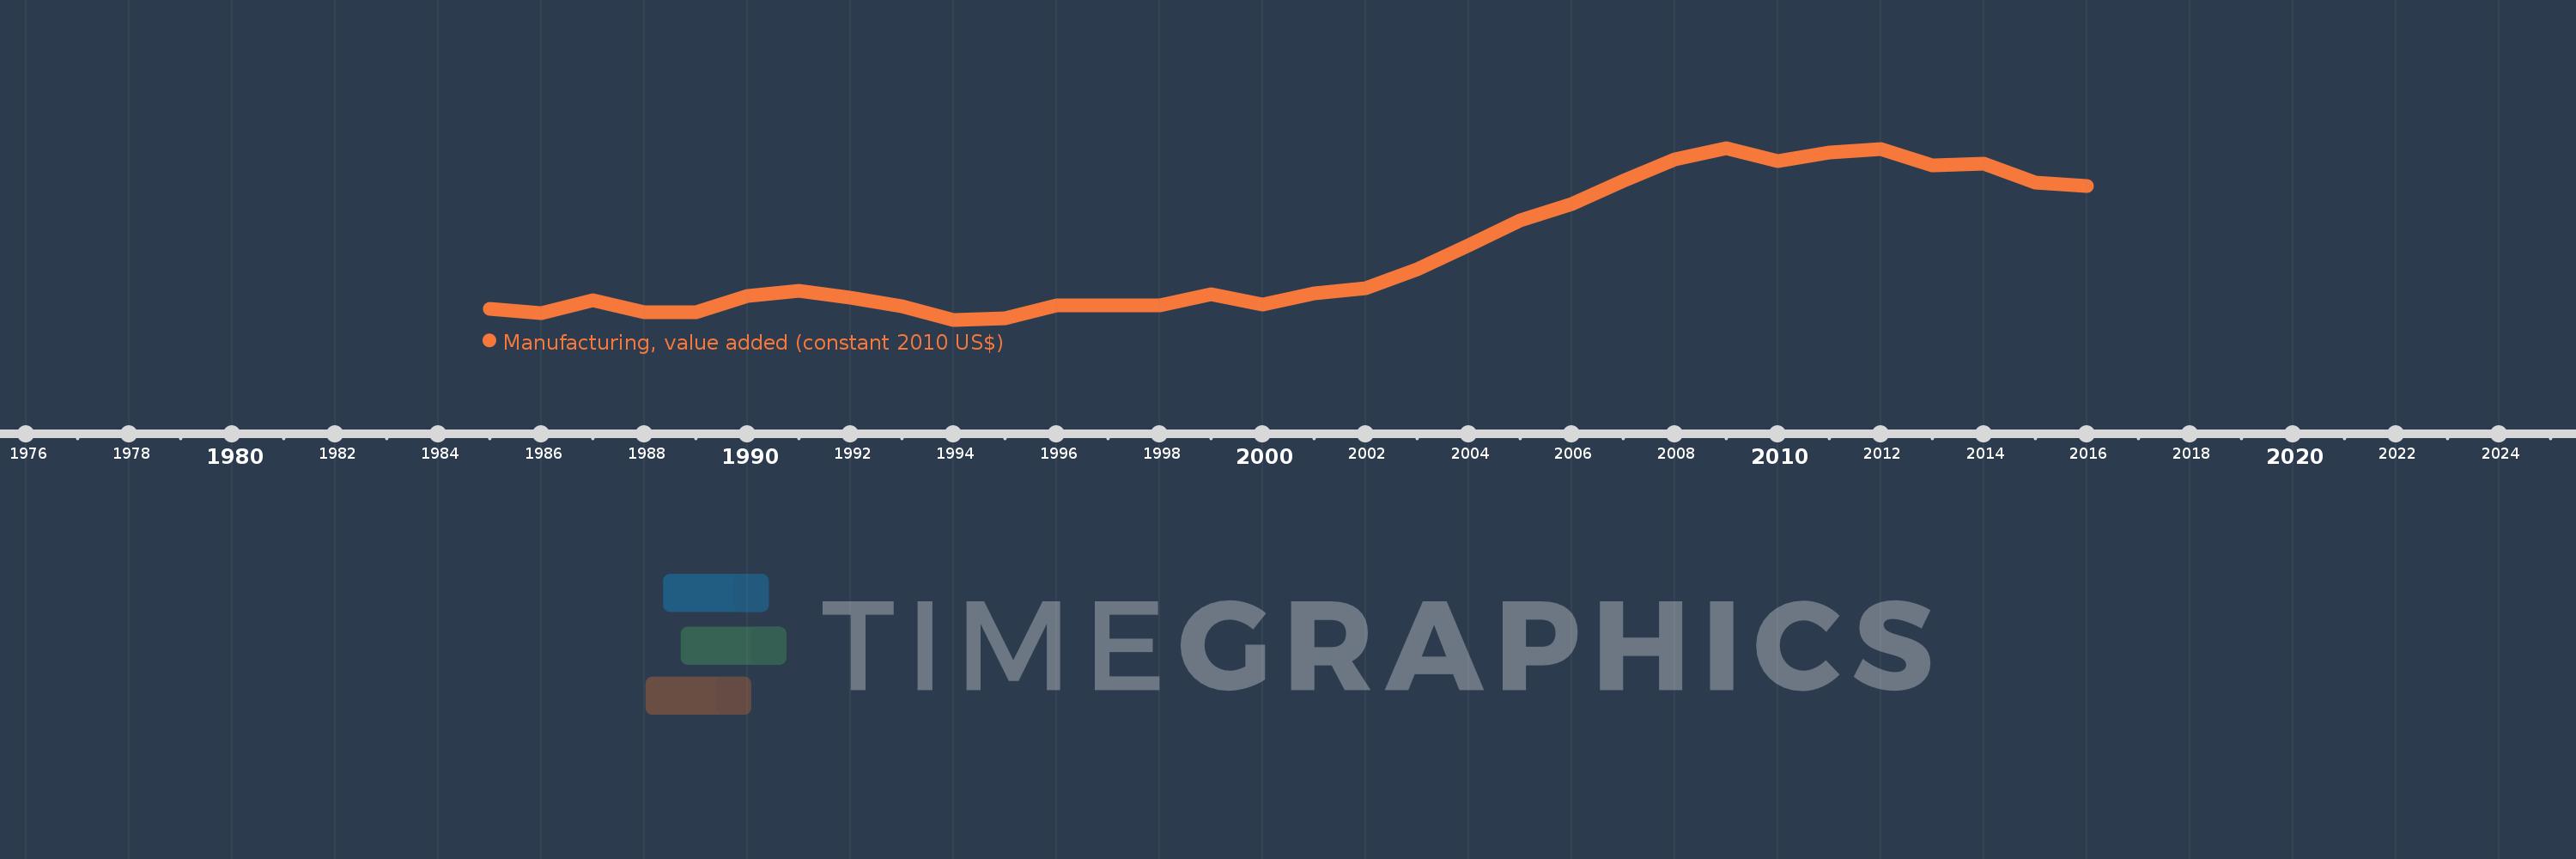
Manufacturing, value added (constant 2010 US$)
2016,2015,2014,2013,2012,2011,2010,2009,2008,2007,2006,2005,2004,2003,2002,2001,2000,1999,1998,1997,1996,1995,1994,1993,1992,1991,1990,1989,1988,1987,1986,1985
This statistics in other country:
AfghanistanAlbaniaAndorraAntigua and BarbudaArab WorldArgentinaArmeniaArubaAustraliaAustriaAzerbaijanBahamas, TheBahrainBangladeshBarbadosBelarusBelgiumBelizeBeninBermudaBhutanBoliviaBosnia and HerzegovinaBotswanaBrazilBrunei DarussalamBurkina FasoBurundiCambodiaCameroonCanadaCaribbean small statesCentral African RepublicCentral Europe and the BalticsChadChileChinaColombiaComorosCongo, Dem. Rep.Congo, Rep.Costa RicaCote d'IvoireCroatiaCubaCyprusCzech RepublicDenmarkDominicaDominican RepublicEarly-demographic dividendEast Asia & PacificEast Asia & Pacific (excluding high income)East Asia & Pacific (IDA & IBRD countries)EcuadorEgypt, Arab Rep.El SalvadorEquatorial GuineaEstoniaEthiopiaEuro areaEurope & Central AsiaEurope & Central Asia (excluding high income)Europe & Central Asia (IDA & IBRD countries)European UnionFaroe IslandsFijiFinlandFragile and conflict affected situationsFranceGabonGambia, TheGeorgiaGermanyGhanaGreeceGrenadaGuatemalaGuineaGuyanaHeavily indebted poor countries (HIPC)High incomeHondurasHong Kong SAR, ChinaHungaryIBRD onlyIcelandIDA & IBRD totalIDA blendIDA onlyIDA totalIndiaIndonesiaIran, Islamic Rep.IraqIrelandItalyJamaicaJapanJordanKazakhstanKenyaKiribatiKorea, Rep.KosovoKuwaitKyrgyz RepublicLao PDRLate-demographic dividendLatin America & Caribbean Latin America & Caribbean (excluding high income)Latin America & the Caribbean (IDA & IBRD countries)LatviaLeast developed countries: UN classificationLebanonLesothoLiberiaLithuaniaLow & middle incomeLow incomeLower middle incomeLuxembourgMacao SAR, ChinaMacedonia, FYRMalawiMalaysiaMaldivesMaltaMarshall IslandsMauritaniaMauritiusMexicoMicronesia, Fed. Sts.Middle East & North AfricaMiddle East & North Africa (excluding high income)Middle East & North Africa (IDA & IBRD countries)Middle incomeMoldovaMongoliaMontenegroMoroccoMozambiqueMyanmarNamibiaNepalNetherlandsNew ZealandNicaraguaNigerNigeriaNorth AmericaNorwayOECD membersOmanOther small statesPacific island small statesPakistanPalauPanamaParaguayPeruPhilippinesPolandPortugalPost-demographic dividendPre-demographic dividendPuerto RicoQatarRomaniaRussian FederationRwandaSamoaSao Tome and PrincipeSaudi ArabiaSenegalSerbiaSeychellesSierra LeoneSingaporeSlovak RepublicSloveniaSmall statesSouth AfricaSouth AsiaSouth Asia (IDA & IBRD)SpainSri LankaSt. Kitts and NevisSt. LuciaSt. Vincent and the GrenadinesSub-Saharan Africa Sub-Saharan Africa (excluding high income)Sub-Saharan Africa (IDA & IBRD countries)SudanSurinameSwazilandSwedenSwitzerlandTajikistanTanzaniaThailandTimor-LesteTogoTongaTrinidad and TobagoTunisiaTurkeyTuvaluUgandaUkraineUnited Arab EmiratesUnited KingdomUnited StatesUpper middle incomeUruguayUzbekistanVanuatuVenezuela, RBVietnamWest Bank and GazaWorldYemen, Rep.ZambiaZimbabwe Timeline:
This timeline shows a graph from 1985 to 2016 of Caribbean small states. No data until 1984. Number of actual observations by date: 32.
Source name:
World Development Indicators
Source organization:
World Bank national accounts data, and OECD National Accounts data files.
Categories, topics:
Economy & Growth
Last updated:
apr 23, 2017
Indicators value changes by year
Minimum:
2.866 bln
jan 1, 1994
Maximum:
4.37 bln
jan 1, 2009
At the date of observation
Value
Absolute change
Change from previous value
jan 1, 1985
2.963 bln
+2.963 bln
0.0%
jan 1, 1986
2.92 bln
-42.841 mln
-1.45%
jan 1, 1987
3.04 bln
+119.255 mln
4.08%
jan 1, 1988
2.931 bln
-108.824 mln
-3.58%
jan 1, 1989
2.928 bln
-3.125 mln
-0.11%
jan 1, 1990
3.072 bln
+144.687 mln
4.94%
jan 1, 1991
3.121 bln
+49.059 mln
1.6%
jan 1, 1992
3.062 bln
-59.131 mln
-1.89%
jan 1, 1993
2.984 bln
-78.184 mln
-2.55%
jan 1, 1994
2.866 bln
-118.579 mln
-3.97%
jan 1, 1995
2.876 bln
+10.857 mln
0.38%
jan 1, 1996
2.989 bln
+112.393 mln
3.91%
jan 1, 1997
2.994 bln
+5.193 mln
0.17%
jan 1, 1998
2.988 bln
-5.917 mln
-0.2%
jan 1, 1999
3.089 bln
+101.453 mln
3.4%
jan 1, 2000
2.995 bln
-94.239 mln
-3.05%
jan 1, 2001
3.093 bln
+97.793 mln
3.26%
jan 1, 2002
3.145 bln
+51.581 mln
1.67%
jan 1, 2003
3.309 bln
+164.756 mln
5.24%
jan 1, 2004
3.515 bln
+205.748 mln
6.22%
jan 1, 2005
3.738 bln
+222.752 mln
6.34%
jan 1, 2006
3.881 bln
+143.591 mln
3.84%
jan 1, 2007
4.079 bln
+197.618 mln
5.09%
jan 1, 2008
4.266 bln
+187.249 mln
4.59%
jan 1, 2009
4.37 bln
+103.396 mln
2.42%
jan 1, 2010
4.256 bln
-113.672 mln
-2.6%
jan 1, 2011
4.331 bln
+74.55 mln
1.75%
jan 1, 2012
4.363 bln
+32.444 mln
0.75%
jan 1, 2013
4.214 bln
-149.287 mln
-3.42%
jan 1, 2014
4.23 bln
+15.761 mln
0.37%
jan 1, 2015
4.069 bln
-160.465 mln
-3.79%
jan 1, 2016
4.035 bln
-34.297 mln
-0.84%
Ranking of countries by current statistics by years


Comments: