29
/
en
AIzaSyAYiBZKx7MnpbEhh9jyipgxe19OcubqV5w
April 1, 2024
40082
IDA total
IDA
false
2
1
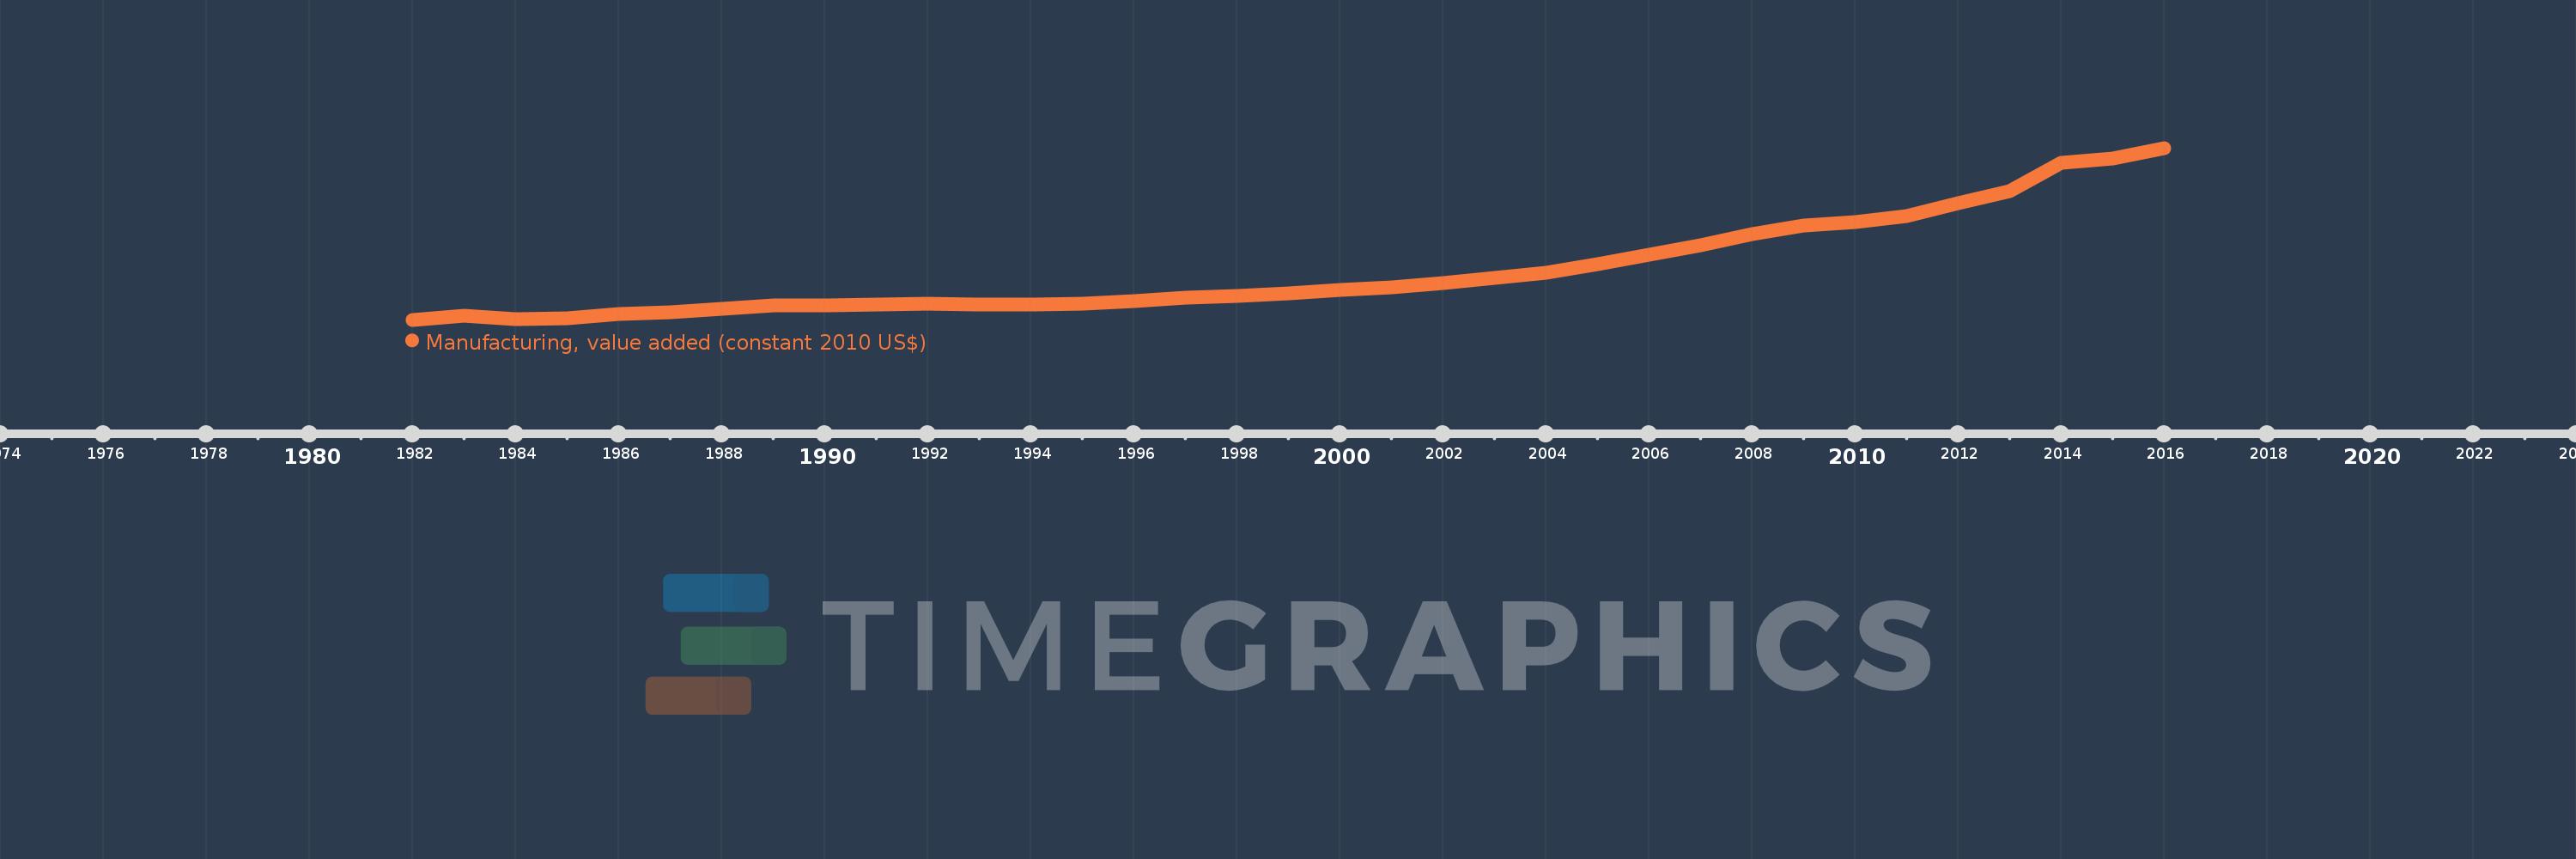
Manufacturing, value added (constant 2010 US$)
2016,2015,2014,2013,2012,2011,2010,2009,2008,2007,2006,2005,2004,2003,2002,2001,2000,1999,1998,1997,1996,1995,1994,1993,1992,1991,1990,1989,1988,1987,1986,1985,1984,1983,1982
This statistics in other country:
AfghanistanAlbaniaAndorraAntigua and BarbudaArab WorldArgentinaArmeniaArubaAustraliaAustriaAzerbaijanBahamas, TheBahrainBangladeshBarbadosBelarusBelgiumBelizeBeninBermudaBhutanBoliviaBosnia and HerzegovinaBotswanaBrazilBrunei DarussalamBurkina FasoBurundiCambodiaCameroonCanadaCaribbean small statesCentral African RepublicCentral Europe and the BalticsChadChileChinaColombiaComorosCongo, Dem. Rep.Congo, Rep.Costa RicaCote d'IvoireCroatiaCubaCyprusCzech RepublicDenmarkDominicaDominican RepublicEarly-demographic dividendEast Asia & PacificEast Asia & Pacific (excluding high income)East Asia & Pacific (IDA & IBRD countries)EcuadorEgypt, Arab Rep.El SalvadorEquatorial GuineaEstoniaEthiopiaEuro areaEurope & Central AsiaEurope & Central Asia (excluding high income)Europe & Central Asia (IDA & IBRD countries)European UnionFaroe IslandsFijiFinlandFragile and conflict affected situationsFranceGabonGambia, TheGeorgiaGermanyGhanaGreeceGrenadaGuatemalaGuineaGuyanaHeavily indebted poor countries (HIPC)High incomeHondurasHong Kong SAR, ChinaHungaryIBRD onlyIcelandIDA & IBRD totalIDA blendIDA onlyIDA totalIndiaIndonesiaIran, Islamic Rep.IraqIrelandItalyJamaicaJapanJordanKazakhstanKenyaKiribatiKorea, Rep.KosovoKuwaitKyrgyz RepublicLao PDRLate-demographic dividendLatin America & Caribbean Latin America & Caribbean (excluding high income)Latin America & the Caribbean (IDA & IBRD countries)LatviaLeast developed countries: UN classificationLebanonLesothoLiberiaLithuaniaLow & middle incomeLow incomeLower middle incomeLuxembourgMacao SAR, ChinaMacedonia, FYRMalawiMalaysiaMaldivesMaltaMarshall IslandsMauritaniaMauritiusMexicoMicronesia, Fed. Sts.Middle East & North AfricaMiddle East & North Africa (excluding high income)Middle East & North Africa (IDA & IBRD countries)Middle incomeMoldovaMongoliaMontenegroMoroccoMozambiqueMyanmarNamibiaNepalNetherlandsNew ZealandNicaraguaNigerNigeriaNorth AmericaNorwayOECD membersOmanOther small statesPacific island small statesPakistanPalauPanamaParaguayPeruPhilippinesPolandPortugalPost-demographic dividendPre-demographic dividendPuerto RicoQatarRomaniaRussian FederationRwandaSamoaSao Tome and PrincipeSaudi ArabiaSenegalSerbiaSeychellesSierra LeoneSingaporeSlovak RepublicSloveniaSmall statesSouth AfricaSouth AsiaSouth Asia (IDA & IBRD)SpainSri LankaSt. Kitts and NevisSt. LuciaSt. Vincent and the GrenadinesSub-Saharan Africa Sub-Saharan Africa (excluding high income)Sub-Saharan Africa (IDA & IBRD countries)SudanSurinameSwazilandSwedenSwitzerlandTajikistanTanzaniaThailandTimor-LesteTogoTongaTrinidad and TobagoTunisiaTurkeyTuvaluUgandaUkraineUnited Arab EmiratesUnited KingdomUnited StatesUpper middle incomeUruguayUzbekistanVanuatuVenezuela, RBVietnamWest Bank and GazaWorldYemen, Rep.ZambiaZimbabwe Timeline:
This timeline shows a graph from 1982 to 2016 of IDA total. No data until 1981. Number of actual observations by date: 35.
Source name:
World Development Indicators
Source organization:
World Bank national accounts data, and OECD National Accounts data files.
Categories, topics:
Economy & Growth
Last updated:
apr 23, 2017
Indicators value changes by year
Minimum:
54.328 bln
jan 1, 1982
Maximum:
238.694 bln
jan 1, 2016
At the date of observation
Value
Absolute change
Change from previous value
jan 1, 1982
54.328 bln
+54.328 bln
0.0%
jan 1, 1983
58.254 bln
+3.926 bln
7.23%
jan 1, 1984
54.669 bln
-3.584 bln
-6.15%
jan 1, 1985
55.564 bln
+894.636 mln
1.64%
jan 1, 1986
60.478 bln
+4.914 bln
8.84%
jan 1, 1987
62.583 bln
+2.106 bln
3.48%
jan 1, 1988
65.864 bln
+3.28 bln
5.24%
jan 1, 1989
69.597 bln
+3.734 bln
5.67%
jan 1, 1990
70.127 bln
+529.877 mln
0.76%
jan 1, 1991
70.719 bln
+591.309 mln
0.84%
jan 1, 1992
71.495 bln
+776.79 mln
1.1%
jan 1, 1993
70.908 bln
-587.857 mln
-0.82%
jan 1, 1994
70.551 bln
-356.295 mln
-0.5%
jan 1, 1995
71.722 bln
+1.171 bln
1.66%
jan 1, 1996
74.383 bln
+2.661 bln
3.71%
jan 1, 1997
78.074 bln
+3.69 bln
4.96%
jan 1, 1998
80.149 bln
+2.076 bln
2.66%
jan 1, 1999
82.365 bln
+2.215 bln
2.76%
jan 1, 2000
86.039 bln
+3.675 bln
4.46%
jan 1, 2001
89.281 bln
+3.242 bln
3.77%
jan 1, 2002
93.835 bln
+4.554 bln
5.1%
jan 1, 2003
98.845 bln
+5.009 bln
5.34%
jan 1, 2004
104.835 bln
+5.99 bln
6.06%
jan 1, 2005
113.722 bln
+8.887 bln
8.48%
jan 1, 2006
123.8 bln
+10.078 bln
8.86%
jan 1, 2007
134.654 bln
+10.854 bln
8.77%
jan 1, 2008
146.034 bln
+11.38 bln
8.45%
jan 1, 2009
155.311 bln
+9.277 bln
6.35%
jan 1, 2010
159.57 bln
+4.258 bln
2.74%
jan 1, 2011
165.195 bln
+5.625 bln
3.53%
jan 1, 2012
179.758 bln
+14.563 bln
8.82%
jan 1, 2013
192.301 bln
+12.544 bln
6.98%
jan 1, 2014
222.566 bln
+30.265 bln
15.74%
jan 1, 2015
227.099 bln
+4.532 bln
2.04%
jan 1, 2016
238.694 bln
+11.596 bln
5.11%
Ranking of countries by current statistics by years


Comments: