29
/
en
AIzaSyAYiBZKx7MnpbEhh9jyipgxe19OcubqV5w
April 1, 2024
74143
Austria
AUT
true
2
1
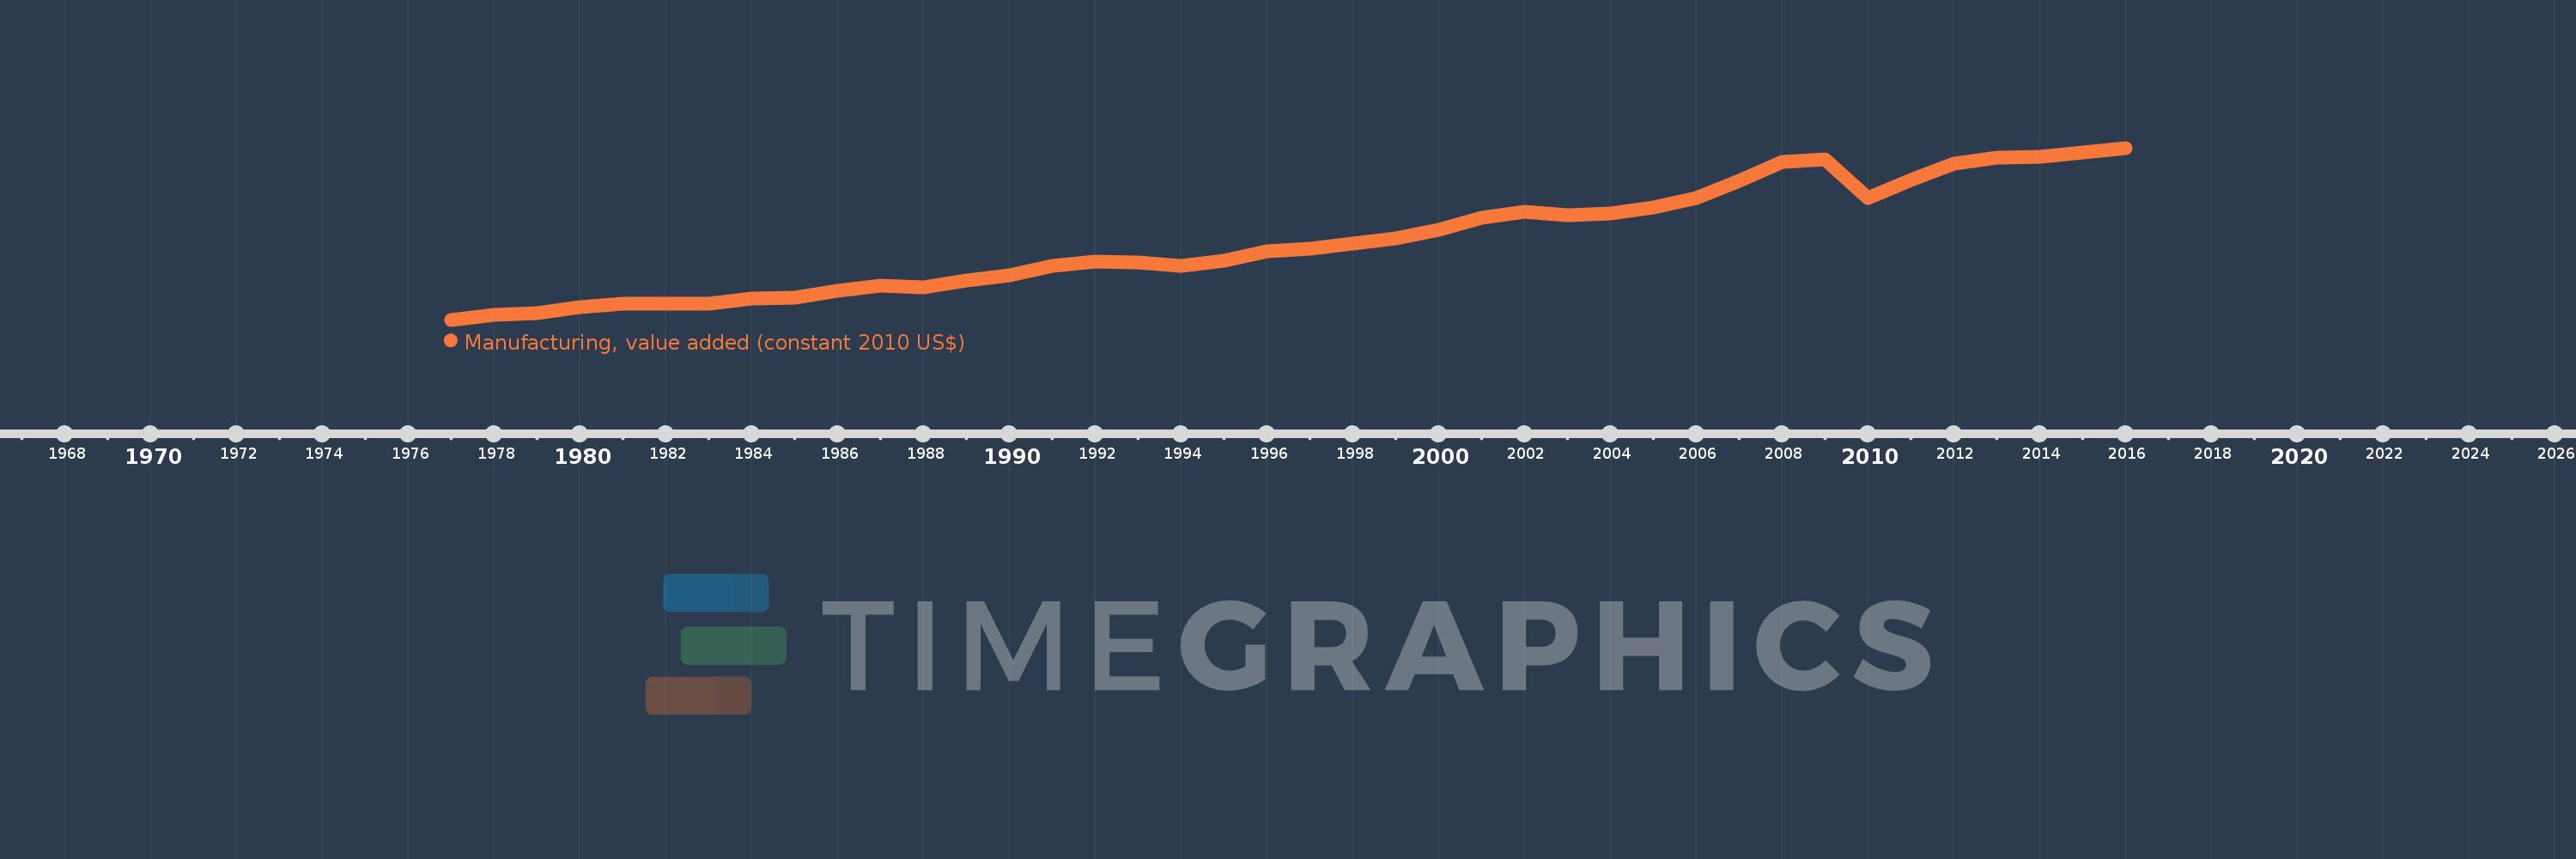
Manufacturing, value added (constant 2010 US$)
2016,2015,2014,2013,2012,2011,2010,2009,2008,2007,2006,2005,2004,2003,2002,2001,2000,1999,1998,1997,1996,1995,1994,1993,1992,1991,1990,1989,1988,1987,1986,1985,1984,1983,1982,1981,1980,1979,1978,1977
This statistics in other country:
AfghanistanAlbaniaAndorraAntigua and BarbudaArab WorldArgentinaArmeniaArubaAustraliaAustriaAzerbaijanBahamas, TheBahrainBangladeshBarbadosBelarusBelgiumBelizeBeninBermudaBhutanBoliviaBosnia and HerzegovinaBotswanaBrazilBrunei DarussalamBurkina FasoBurundiCambodiaCameroonCanadaCaribbean small statesCentral African RepublicCentral Europe and the BalticsChadChileChinaColombiaComorosCongo, Dem. Rep.Congo, Rep.Costa RicaCote d'IvoireCroatiaCubaCyprusCzech RepublicDenmarkDominicaDominican RepublicEarly-demographic dividendEast Asia & PacificEast Asia & Pacific (excluding high income)East Asia & Pacific (IDA & IBRD countries)EcuadorEgypt, Arab Rep.El SalvadorEquatorial GuineaEstoniaEthiopiaEuro areaEurope & Central AsiaEurope & Central Asia (excluding high income)Europe & Central Asia (IDA & IBRD countries)European UnionFaroe IslandsFijiFinlandFragile and conflict affected situationsFranceGabonGambia, TheGeorgiaGermanyGhanaGreeceGrenadaGuatemalaGuineaGuyanaHeavily indebted poor countries (HIPC)High incomeHondurasHong Kong SAR, ChinaHungaryIBRD onlyIcelandIDA & IBRD totalIDA blendIDA onlyIDA totalIndiaIndonesiaIran, Islamic Rep.IraqIrelandItalyJamaicaJapanJordanKazakhstanKenyaKiribatiKorea, Rep.KosovoKuwaitKyrgyz RepublicLao PDRLate-demographic dividendLatin America & Caribbean Latin America & Caribbean (excluding high income)Latin America & the Caribbean (IDA & IBRD countries)LatviaLeast developed countries: UN classificationLebanonLesothoLiberiaLithuaniaLow & middle incomeLow incomeLower middle incomeLuxembourgMacao SAR, ChinaMacedonia, FYRMalawiMalaysiaMaldivesMaltaMarshall IslandsMauritaniaMauritiusMexicoMicronesia, Fed. Sts.Middle East & North AfricaMiddle East & North Africa (excluding high income)Middle East & North Africa (IDA & IBRD countries)Middle incomeMoldovaMongoliaMontenegroMoroccoMozambiqueMyanmarNamibiaNepalNetherlandsNew ZealandNicaraguaNigerNigeriaNorth AmericaNorwayOECD membersOmanOther small statesPacific island small statesPakistanPalauPanamaParaguayPeruPhilippinesPolandPortugalPost-demographic dividendPre-demographic dividendPuerto RicoQatarRomaniaRussian FederationRwandaSamoaSao Tome and PrincipeSaudi ArabiaSenegalSerbiaSeychellesSierra LeoneSingaporeSlovak RepublicSloveniaSmall statesSouth AfricaSouth AsiaSouth Asia (IDA & IBRD)SpainSri LankaSt. Kitts and NevisSt. LuciaSt. Vincent and the GrenadinesSub-Saharan Africa Sub-Saharan Africa (excluding high income)Sub-Saharan Africa (IDA & IBRD countries)SudanSurinameSwazilandSwedenSwitzerlandTajikistanTanzaniaThailandTimor-LesteTogoTongaTrinidad and TobagoTunisiaTurkeyTuvaluUgandaUkraineUnited Arab EmiratesUnited KingdomUnited StatesUpper middle incomeUruguayUzbekistanVanuatuVenezuela, RBVietnamWest Bank and GazaWorldYemen, Rep.ZambiaZimbabwe Timeline:
This timeline shows a graph from 1977 to 2016 of Austria. No data until 1976. Number of actual observations by date: 40.
Source name:
World Development Indicators
Source organization:
World Bank national accounts data, and OECD National Accounts data files.
Categories, topics:
Economy & Growth
Last updated:
apr 23, 2017
Indicators value changes by year
Minimum:
27.507 bln
jan 1, 1977
Maximum:
73.434 bln
jan 1, 2016
At the date of observation
Value
Absolute change
Change from previous value
jan 1, 1977
27.507 bln
+27.507 bln
0.0%
jan 1, 1978
28.77 bln
+1.264 bln
4.59%
jan 1, 1979
29.308 bln
+537.768 mln
1.87%
jan 1, 1980
30.79 bln
+1.482 bln
5.06%
jan 1, 1981
31.865 bln
+1.075 bln
3.49%
jan 1, 1982
31.867 bln
+2.2 mln
0.01%
jan 1, 1983
31.843 bln
-24.035 mln
-0.08%
jan 1, 1984
33.177 bln
+1.334 bln
4.19%
jan 1, 1985
33.334 bln
+156.659 mln
0.47%
jan 1, 1986
35.283 bln
+1.949 bln
5.85%
jan 1, 1987
36.61 bln
+1.327 bln
3.76%
jan 1, 1988
36.159 bln
-451.308 mln
-1.23%
jan 1, 1989
37.943 bln
+1.784 bln
4.93%
jan 1, 1990
39.32 bln
+1.376 bln
3.63%
jan 1, 1991
41.841 bln
+2.522 bln
6.41%
jan 1, 1992
42.968 bln
+1.127 bln
2.69%
jan 1, 1993
42.748 bln
-219.872 mln
-0.51%
jan 1, 1994
41.834 bln
-914.834 mln
-2.14%
jan 1, 1995
43.385 bln
+1.552 bln
3.71%
jan 1, 1996
45.918 bln
+2.533 bln
5.84%
jan 1, 1997
46.414 bln
+496.689 mln
1.08%
jan 1, 1998
47.937 bln
+1.522 bln
3.28%
jan 1, 1999
49.24 bln
+1.304 bln
2.72%
jan 1, 2000
51.439 bln
+2.199 bln
4.47%
jan 1, 2001
54.814 bln
+3.374 bln
6.56%
jan 1, 2002
56.362 bln
+1.548 bln
2.82%
jan 1, 2003
55.526 bln
-835.391 mln
-1.48%
jan 1, 2004
55.842 bln
+316.106 mln
0.57%
jan 1, 2005
57.531 bln
+1.689 bln
3.02%
jan 1, 2006
60.044 bln
+2.513 bln
4.37%
jan 1, 2007
64.7 bln
+4.657 bln
7.76%
jan 1, 2008
69.742 bln
+5.041 bln
7.79%
jan 1, 2009
70.374 bln
+632.04 mln
0.91%
jan 1, 2010
60.018 bln
-10.356 bln
-14.72%
jan 1, 2011
64.878 bln
+4.86 bln
8.1%
jan 1, 2012
69.122 bln
+4.244 bln
6.54%
jan 1, 2013
70.81 bln
+1.688 bln
2.44%
jan 1, 2014
71.033 bln
+223.272 mln
0.32%
jan 1, 2015
72.141 bln
+1.108 bln
1.56%
jan 1, 2016
73.434 bln
+1.293 bln
1.79%
Ranking of countries by current statistics by years


Comments: