29
/
en
AIzaSyAYiBZKx7MnpbEhh9jyipgxe19OcubqV5w
April 1, 2024
207019
Nepal
NPL
true
2
1
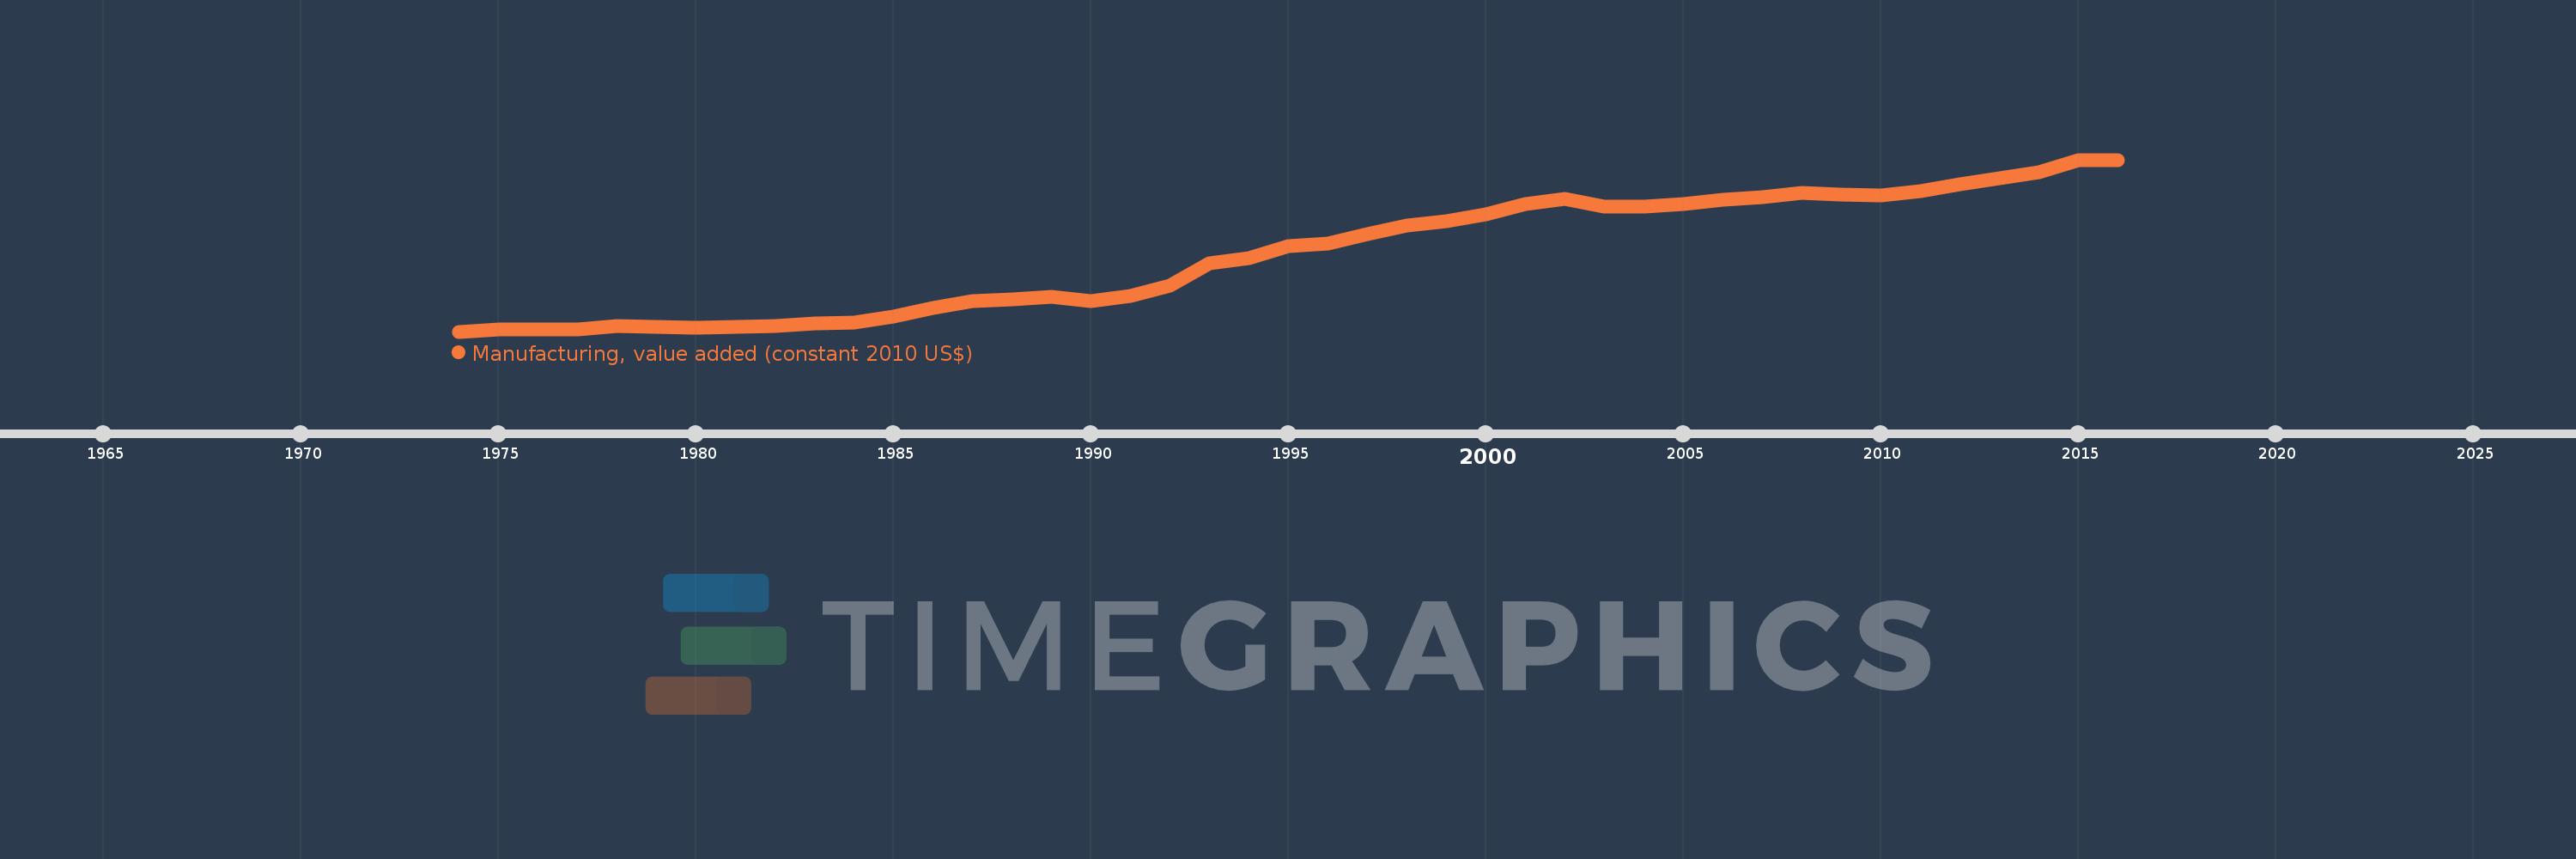
Manufacturing, value added (constant 2010 US$)
2016,2015,2014,2013,2012,2011,2010,2009,2008,2007,2006,2005,2004,2003,2002,2001,2000,1999,1998,1997,1996,1995,1994,1993,1992,1991,1990,1989,1988,1987,1986,1985,1984,1983,1982,1981,1980,1979,1978,1977,1976,1975,1974
This statistics in other country:
AfghanistanAlbaniaAndorraAntigua and BarbudaArab WorldArgentinaArmeniaArubaAustraliaAustriaAzerbaijanBahamas, TheBahrainBangladeshBarbadosBelarusBelgiumBelizeBeninBermudaBhutanBoliviaBosnia and HerzegovinaBotswanaBrazilBrunei DarussalamBurkina FasoBurundiCambodiaCameroonCanadaCaribbean small statesCentral African RepublicCentral Europe and the BalticsChadChileChinaColombiaComorosCongo, Dem. Rep.Congo, Rep.Costa RicaCote d'IvoireCroatiaCubaCyprusCzech RepublicDenmarkDominicaDominican RepublicEarly-demographic dividendEast Asia & PacificEast Asia & Pacific (excluding high income)East Asia & Pacific (IDA & IBRD countries)EcuadorEgypt, Arab Rep.El SalvadorEquatorial GuineaEstoniaEthiopiaEuro areaEurope & Central AsiaEurope & Central Asia (excluding high income)Europe & Central Asia (IDA & IBRD countries)European UnionFaroe IslandsFijiFinlandFragile and conflict affected situationsFranceGabonGambia, TheGeorgiaGermanyGhanaGreeceGrenadaGuatemalaGuineaGuyanaHeavily indebted poor countries (HIPC)High incomeHondurasHong Kong SAR, ChinaHungaryIBRD onlyIcelandIDA & IBRD totalIDA blendIDA onlyIDA totalIndiaIndonesiaIran, Islamic Rep.IraqIrelandItalyJamaicaJapanJordanKazakhstanKenyaKiribatiKorea, Rep.KosovoKuwaitKyrgyz RepublicLao PDRLate-demographic dividendLatin America & Caribbean Latin America & Caribbean (excluding high income)Latin America & the Caribbean (IDA & IBRD countries)LatviaLeast developed countries: UN classificationLebanonLesothoLiberiaLithuaniaLow & middle incomeLow incomeLower middle incomeLuxembourgMacao SAR, ChinaMacedonia, FYRMalawiMalaysiaMaldivesMaltaMarshall IslandsMauritaniaMauritiusMexicoMicronesia, Fed. Sts.Middle East & North AfricaMiddle East & North Africa (excluding high income)Middle East & North Africa (IDA & IBRD countries)Middle incomeMoldovaMongoliaMontenegroMoroccoMozambiqueMyanmarNamibiaNepalNetherlandsNew ZealandNicaraguaNigerNigeriaNorth AmericaNorwayOECD membersOmanOther small statesPacific island small statesPakistanPalauPanamaParaguayPeruPhilippinesPolandPortugalPost-demographic dividendPre-demographic dividendPuerto RicoQatarRomaniaRussian FederationRwandaSamoaSao Tome and PrincipeSaudi ArabiaSenegalSerbiaSeychellesSierra LeoneSingaporeSlovak RepublicSloveniaSmall statesSouth AfricaSouth AsiaSouth Asia (IDA & IBRD)SpainSri LankaSt. Kitts and NevisSt. LuciaSt. Vincent and the GrenadinesSub-Saharan Africa Sub-Saharan Africa (excluding high income)Sub-Saharan Africa (IDA & IBRD countries)SudanSurinameSwazilandSwedenSwitzerlandTajikistanTanzaniaThailandTimor-LesteTogoTongaTrinidad and TobagoTunisiaTurkeyTuvaluUgandaUkraineUnited Arab EmiratesUnited KingdomUnited StatesUpper middle incomeUruguayUzbekistanVanuatuVenezuela, RBVietnamWest Bank and GazaWorldYemen, Rep.ZambiaZimbabwe Timeline:
This timeline shows a graph from 1974 to 2016 of Nepal. No data until 1973. Number of actual observations by date: 43.
Source name:
World Development Indicators
Source organization:
World Bank national accounts data, and OECD National Accounts data files.
Categories, topics:
Economy & Growth
Last updated:
apr 23, 2017
Indicators value changes by year
Minimum:
129.136 mln
jan 1, 1974
Maximum:
1.135 bln
jan 1, 2016
At the date of observation
Value
Absolute change
Change from previous value
jan 1, 1974
129.136 mln
+129.136 mln
0.0%
jan 1, 1975
140.896 mln
+11.761 mln
9.11%
jan 1, 1976
139.474 mln
-1.422 mln
-1.01%
jan 1, 1977
144.152 mln
+4.677 mln
3.35%
jan 1, 1978
159.446 mln
+15.294 mln
10.61%
jan 1, 1979
157.272 mln
-2.173 mln
-1.36%
jan 1, 1980
152.729 mln
-4.544 mln
-2.89%
jan 1, 1981
156.657 mln
+3.928 mln
2.57%
jan 1, 1982
162.659 mln
+6.002 mln
3.83%
jan 1, 1983
176.264 mln
+13.606 mln
8.36%
jan 1, 1984
184.379 mln
+8.114 mln
4.6%
jan 1, 1985
215.587 mln
+31.208 mln
16.93%
jan 1, 1986
267.53 mln
+51.944 mln
24.09%
jan 1, 1987
308.123 mln
+40.593 mln
15.17%
jan 1, 1988
315.262 mln
+7.138 mln
2.32%
jan 1, 1989
333.267 mln
+18.006 mln
5.71%
jan 1, 1990
309.721 mln
-23.546 mln
-7.07%
jan 1, 1991
340.086 mln
+30.365 mln
9.8%
jan 1, 1992
400.177 mln
+60.09 mln
17.67%
jan 1, 1993
528.242 mln
+128.065 mln
32.0%
jan 1, 1994
561.057 mln
+32.815 mln
6.21%
jan 1, 1995
630.204 mln
+69.147 mln
12.32%
jan 1, 1996
642.563 mln
+12.359 mln
1.96%
jan 1, 1997
700.629 mln
+58.066 mln
9.04%
jan 1, 1998
750.065 mln
+49.436 mln
7.06%
jan 1, 1999
775.742 mln
+25.677 mln
3.42%
jan 1, 2000
816.761 mln
+41.019 mln
5.29%
jan 1, 2001
875.573 mln
+58.812 mln
7.2%
jan 1, 2002
907.094 mln
+31.521 mln
3.6%
jan 1, 2003
858.797 mln
-48.296 mln
-5.32%
jan 1, 2004
859.175 mln
+377.867K
0.04%
jan 1, 2005
877.667 mln
+18.492 mln
2.15%
jan 1, 2006
900.646 mln
+22.979 mln
2.62%
jan 1, 2007
918.642 mln
+17.996 mln
2.0%
jan 1, 2008
942.094 mln
+23.451 mln
2.55%
jan 1, 2009
933.922 mln
-8.171 mln
-0.87%
jan 1, 2010
924.168 mln
-9.754 mln
-1.04%
jan 1, 2011
951.54 mln
+27.372 mln
2.96%
jan 1, 2012
990.083 mln
+38.542 mln
4.05%
jan 1, 2013
1.026 bln
+35.945 mln
3.63%
jan 1, 2014
1.064 bln
+38.117 mln
3.72%
jan 1, 2015
1.131 bln
+66.82 mln
6.28%
jan 1, 2016
1.135 bln
+4.235 mln
0.37%
Ranking of countries by current statistics by years


Comments: